|
Key Insights
|
Details
|
|
Forecast Period
|
2027-2031
|
|
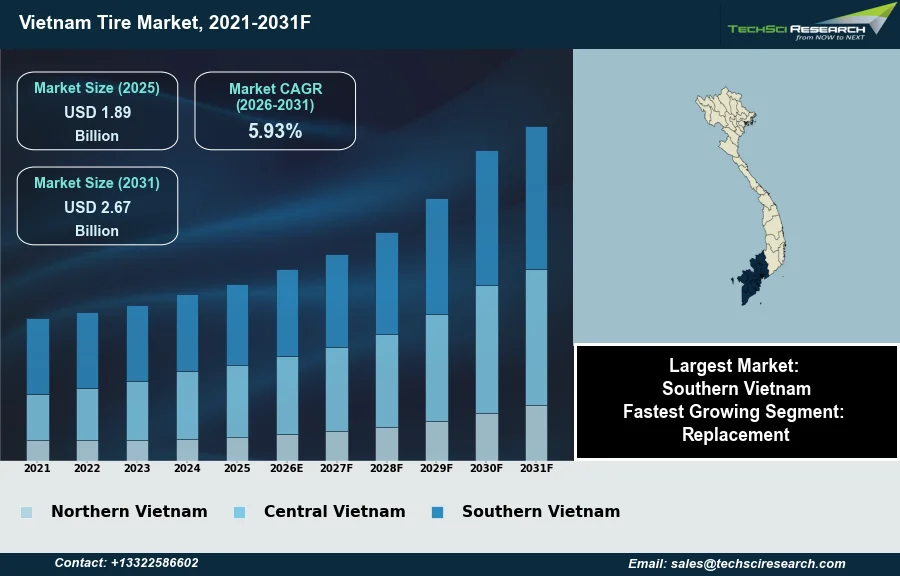
Market Size (2025)
|
USD 1.89 Billion
|
|
CAGR (2026-2031)
|
5.93%
|
|
Fastest Growing Segment
|
Replacement
|
|
Largest Market
|
Southern Vietnam
|
|
Market Size (2031)
|
USD 2.67 Billion
|
Market Overview
The Vietnam Tire Market will grow from USD 1.89 Billion in 2025 to USD 2.67 Billion by 2031 at a 5.93% CAGR. Tires are resilient rubber or composite structures encircling a wheel's rim, providing essential traction, support, and cushioning for vehicles. The Vietnam tire market is fundamentally driven by robust growth in vehicle sales and production, coupled with expanding infrastructure. According to the Vietnam Automobile Manufacturers' Association (VAMA) report, total automobile sales reached 375,736 units in 2025, marking a 10.5% increase from the prior year. This demand is further supported by the significant motorcycle market, with the Vietnam Association of Motorcycle Manufacturers (VAMM) reporting full-year 2025 sales of 2,615,057 units.
Additionally, Vietnam's strategic position as a prominent natural rubber producer offers cost advantages for domestic tire manufacturers. According to the Vietnam Rubber Association (VRA), Vietnam's raw and semi-processed rubber exports amounted to approximately 1.7 million tons, valued at $2.89 billion, in the first eleven months of 2025. However, a significant challenge impeding market expansion is the volatility in raw material prices, such as rubber and steel, directly impacting production costs and manufacturer profitability.
Key Market Drivers
Domestic auto-manufacturing growth drives OE tire demand and capacity expansion
Robust domestic automotive manufacturing growth significantly propels the Vietnam tire market by driving demand for original equipment tires. As local production expands, tire manufacturers benefit from a steady need for tires to equip new vehicles rolling off assembly lines. This growth is evidenced by official statistics indicating strong performance in the automotive sector. According to the Vietnam Automobile Manufacturers' Association, as reported by the Vietnam News Agency in June 2026, auto sales topped 156,700 vehicles in the first five months of 2026, marking a 20 percent year-on-year increase. This sustained expansion in vehicle manufacturing directly translates into increased orders for tire suppliers, fostering production capacity expansions and technological upgrades within the tire industry to meet the evolving demands of modern automotive platforms.
Logistics expansion drives demand for heavy-duty and light commercial-vehicle tires
The expanding logistics and commercial transportation sector also serves as a pivotal driver for the Vietnam tire market, particularly for heavy-duty and light commercial vehicle tires. Growing trade activities, e-commerce, and government investments in infrastructure projects necessitate larger and more active commercial fleets. The demand for replacement tires for these vehicles is consistently high due to extensive usage and payload requirements. Reflecting this trend, according to the Vietnam Automobile Manufacturers' Association, as reported by the Vietnam News Agency in June 2026, commercial vehicle sales rose 32 percent to 50,270 units in the first five months of 2026. Furthermore, significant investments by tire manufacturers underscore confidence in this expanding market. According to BitAuto Malaysia, in 2026, Haohua Tire increased its Phase II investment by 400 million USD in its Vietnam facility.
Download Free Sample Report
Key Market Challenges
Raw Material Price Volatility Raises Costs and Investment Pressure
The volatility in raw material prices presents a substantial impediment to the growth of the Vietnam tire market. Fluctuations in the costs of essential inputs, particularly natural rubber and steel, directly impact the expenses incurred by tire manufacturers. This instability can significantly compress profit margins for domestic producers, making it challenging to maintain competitive pricing strategies or allocate funds for critical investments in manufacturing capabilities and technological advancements.
Rubber Price Surge Increases Costs and Dampens Demand
Specifically, the upward movement in natural rubber prices has contributed to increased production costs for tire companies. According to the Vietnam Rubber Association (VRA), the average realized export price for natural rubber in 2025 reached US$1,775 per tonne, marking an approximate 13.2 percent increase compared to the previous year. Such pronounced increases in raw material costs necessitate adjustments in the final prices of tires, which can subsequently diminish consumer purchasing power and curb overall demand within the market. This scenario directly hinders the growth trajectory of the Vietnam tire industry by affecting both producer profitability and market absorption capacity.
Key Market Trends
Rising EV Tire Demand Drives Innovation in Vietnam
The rise of electric vehicle specific tire demand represents a significant trend influencing the Vietnam tire market as the country embraces sustainable mobility solutions. This growing segment requires specialized tires engineered for enhanced durability, lower rolling resistance, and reduced noise due to the unique characteristics of electric vehicles, such as heavier battery packs and instant torque delivery. Tire manufacturers in Vietnam are thus compelled to invest in research and development to cater to these evolving performance requirements. In the first four months of 2026, VinFast delivered 78,458 electric vehicles in Vietnam, marking a 76% increase from the same period last year, according to a report by Vietcap Securities in June 2026. This substantial growth in the domestic electric vehicle fleet directly stimulates demand for purpose-built EV tires, driving product innovation and diversification within the local tire industry.
Vietnam Emerges as Global Tire Export Hub
Concurrently, Vietnam's emergence as a global tire manufacturing and export hub is a pivotal trend reshaping the market. The country’s strategic location, competitive labor costs, and favorable trade agreements attract substantial foreign direct investment into tire production facilities, positioning Vietnam as a key supplier to international markets. This shift necessitates increased production capacity and adherence to global quality and environmental standards for exported tires. According to the Observatory of Economic Complexity (OEC), as reported by TheInvestor.vn in March 2026, Vietnam's tire exports totaled $2.98 billion in 2024, securing its position as the ninth-largest global exporter. This robust export performance underscores the increasing role of Vietnamese manufacturers in the international tire supply chain, fostering an outward-looking growth strategy for the domestic industry.
Segmental Insights
Replacement Segment as a Key Growth Driver in Vietnam's Tire Market
The Replacement segment is a key driver of growth within the Vietnam Tire Market, experiencing rapid expansion primarily due to the flourishing automotive aftermarket. This growth is fueled by the inevitable wear and tear on tires as vehicles age, necessitating regular replacements and maintenance. The increasing number of vehicle owners, particularly across passenger cars and two-wheelers, contributes significantly to this demand. Furthermore, rising disposable incomes allow consumers to prioritize higher-quality, more durable tires, while improved road networks and increased vehicle usage lead to a more frequent replacement cycle. This consistent need for tire renewals underscores the segment's robust and sustained growth in Vietnam.
Regional Insights
Southern Vietnam: Leading Region Driving Vietnam's Tire Market
Southern Vietnam stands as the leading region within the Vietnam Tire Market, primarily due to its robust economic growth and extensive urbanization. The substantial expansion of industrial zones and a thriving logistics sector significantly drive demand for both commercial and passenger vehicle tires. A dense population combined with high vehicle ownership, especially two-wheelers, further stimulates a consistent replacement market. Moreover, the strategic development of critical infrastructure, including expressways, contributes to increased tire wear and subsequent replacement frequency. This regional prominence is additionally supported by the presence of major automotive sales and service hubs, ensuring efficient distribution and maintenance. The Ministry of Transport's regulations concerning vehicle safety and quality also shape the market landscape.
Recent Developments
-
In April 2025, Jinyu (Vietnam) Tire Co., Ltd. celebrated the full commissioning of its “Annual Production of 10 million High-Performance Semi-Steel Radial Tire Project” in Tay Ninh Province, Vietnam. This milestone event marks a significant expansion for Jinyu Tire Group, which aims to achieve an annual capacity of 10 million high-performance passenger and light truck (PLT) tires by the second half of 2026. The new production lines are poised to serve global customers and support partners in achieving greater business scale, reflecting the company's commitment to the Vietnamese market.
-
In October 2024, Shandong-based tire manufacturer Haohua commenced production at its new facility in Vietnam. The plant, which became operational on October 28, 2024, is equipped to manufacture both passenger car radial (PCR) and truck and bus radial (TBR) tires. The initial units from both production lines have already been produced, marking a significant development for the company and contributing to Vietnam's growing role in the global tire manufacturing industry. This expansion by Haohua diversifies the product offerings available within the Vietnamese tire market and enhances export capabilities.
-
In January 2024, Kenda Rubber (Vietnam) Co., Ltd., part of the Kenda Group, significantly increased its investment capital by $80 million for its facility in Giang Dien Industrial Park, Trang Bom District. This capital injection by the Taiwanese tire manufacturer underscores its commitment to expanding production and business activities in Vietnam. The increased investment is expected to enhance Kenda Rubber's operational capabilities and contribute to the overall growth and development of the tire manufacturing sector in Vietnam.
-
In 2024, Southern Rubber Industry Joint Stock Company (Casumina) entered into a cooperation agreement with VinFast in Vietnam. This collaboration aims to supply products specifically designed for electric vehicles (EVs). The partnership signifies an important step for Casumina in adapting to the evolving automotive landscape and meeting the growing demand for specialized tires in the electric vehicle segment within Vietnam. This initiative supports the domestic automotive industry and contributes to sustainable mobility solutions in the country.
Key Market Players
- Bridgestone
- Michelin
- Goodyear
- Pirelli
- Continental
- Yokohama
- Hankook
- Apollo Tyres
- MRF
- Dunlop
|
By Vehicle Type
|
By Demand Category
|
By Tire Construction Type
|
By Region
|
- Passenger Car
- Two-Wheelers
- Light Commercial Vehicles (LCV)
- Medium & Heavy Commercial Vehicles (M&HCV)
|
|
|
- Northern
- Central
- Southern
|
Report Scope:
In this report, the Vietnam Tire Market has been segmented into the following categories, in addition to the industry trends which have also been detailed below:
-
Vietnam Tire Market, By Vehicle Type:
-
Passenger Car
-
Two-Wheelers
-
Light Commercial Vehicles (LCV)
-
Medium & Heavy Commercial Vehicles (M&HCV)
-
Vietnam Tire Market, By Demand Category:
-
Vietnam Tire Market, By Tire Construction Type:
-
Vietnam Tire Market, By Region:
-
Northern
-
Central
-
Southern
Competitive Landscape
Company Profiles: Detailed analysis of the major companies present in the Vietnam Tire Market.
Available Customizations:
Vietnam Tire Market report with the given market data, TechSci Research offers customizations according to a company's specific needs. The following customization options are available for the report:
Company Information
- Detailed analysis and profiling of additional market players (up to five).
Vietnam Tire Market is an upcoming report to be released soon. If you wish an early delivery of this report or want to confirm the date of release, please contact us at sales@techsciresearch.com