Why Digital Mention Analysis?
To elucidate and better comprehend the issues that challenge the
advancement of measurement and evaluation of Public Relations, it is
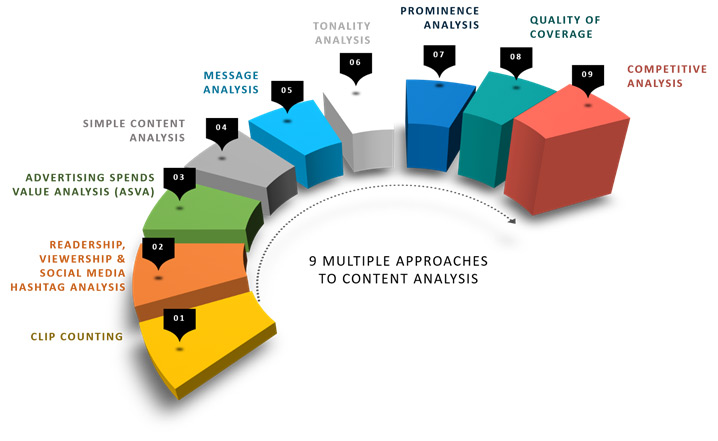
essential to understand the multiple approaches to content analysis that
are already in wide practice. These approaches range from simple “clip
counting” to certain algorithms that measure the quality of coverage. These
approaches are human as well as machine and web-based classification and
analytic systems.
Clip Counting
The most basic – and indeed most antiquated – form of content analysis
includes the collection of all similar articles and putting them in a
chronological order. The analysis generally consists of a summary of all
the listed publications and dates of publications including the total
articles’ count. Typically, these mentions are clubbed together in a
chronological order. One of the analyses often used in clip counting is the
“thud factor” or the volume of noise generated when the book of bound press
clips hits a table. The clip counting analysis contains no insights of the
coverage and is usually dependent on the recipient of the report to draw
judgments about the actual content.
The report is usually qualitative in nature and contains only the analysis
of all the printed publications found via news articles, magazine columns
or blogs.
Readership, Viewership & Social Media Hashtag Analysis
The next level of digital content analysis builds upon the clip counting by
adding information about each & every article that is being gathered
from various secondary data sources. These sources typically include
government sources and mentions of many white papers published by leading
research companies. The specific type of information appended to a clip
counting analysis may include circulation of the publication or number of
copies distributed or total number of page views, the total number of
actual readers (circulation multiplied by average number of readers for
each copy) or Online Users, demographic profiles of the readership/online
users of each article (e.g. age, gender, income, education, lifestyle).
Advertising Value Equivalence (AVE)
Advertising value equivalence is an estimate of the cost of purchase of
advertising along with the relevant portal name and preferable size. These
estimates are typically based on information provided by standard or
prevalent rate and data service.
Simple Content Analysis
This is the form of content analysis that can be analyzed statistically
using advanced statistical tools like R & Python. The codes are being
developed by a close textual analysis of a sample of articles. The
remaining articles are analyzed based on the presence of these codes. Each
article is scrutinized to determine the presence of information that is
organized according to the codes. A database is formed with the help of
information from the codes which helps further to determine the frequency
of codes or classifications of information. This method precisely
represents only what is written.
Message Analysis
Message analysis is done by centering the analysis on the presence of
intended messages in articles. Key messages are developed based on
communication objectives. These communication objectives are “translated”
into codes that become the basis of the analysis. Articles are coded by the
presence of key messages included in each article. The analytic process is
like a simple content analysis where the codes from each article are
entered into a database for statistical analysis.
Tonality Analysis
Tonality is an analysis that uses a subjective assessment of the article’s
content to determine whether it is favorable or unfavorable to the person,
company, organization or product discussed in the text. There are various
ways to assess the tone. One of the most common is scales with positive and
negative ratings & a simple classification of “positive,” “neutral” or
“negative.” Other approaches rate each article or code on a finite scale.
These scales may include a “zero to 100” scale where “zero” is completely
negative and “100” is completely positive. A neutral analysis would be
recorded as “zero” on this scale. This method can be applied using several
different approaches.
Assessment of the tone should be of
- An overall article
- A specific mention or code or the tone of a specific message that may
appear in an article.
- Each article should be assessed individually, and the findings can be
flocked together to present an overall assessment of the tone of the media.
Prominence Analysis
This analysis considers six factors:
1. The Publication/Website/Social Media where the article appears
2. Date of appearance
3. The overall size of the article
4. Location/Page in the publication/website/Social Media it appears
5. The presence of photos or another artwork
6. The size of headlines
In a typical prominence analysis, each element is given a weight which is
further considered into the overall score for each article. That score
determines the benchmark and the prominence of the article.
Quality of Coverage
Quality of coverage is often based on a blend of factors. The factors
included in this analysis are tonality, prominence and inclusion of
specific messages, in addition to the overall volume of articles. Each of
these factors is entered in the calculations that generates a score for
each article in the analysis. This generates a quality of coverage score.
Many of these elements are highly subjective and usually are not tied to
outcomes.
Competitive Analysis
Furthermore, an individual topic, event, brand or company can involve
initiation of content analysis which should also include comparison of the
performance of companies, brands, topics or events on their media coverage.
This can range from comparisons of the total number of mentions to the
share of discussion to comparisons of the overall prominence of one brand
or company receives over another. This is often used to evaluate relative
performance in the media. Other variations of content analysis also exist.
Many of which use proprietary systems and employ a fusion of many of the
techniques discussed.
How to Conduct Competitive Analysis?
Identify Key Competitors
There are two types of competitors: direct and indirect. Those who sell the same products or services while targeting the same customer base as your business are direct competitors. On the other hand, those who sell similar products but target different customer segments are indirect competitors. Identify and research as many direct as well as indirect competitors to better understand their marketing strategy and use it to your advantage. The fastest way to find out your top competitors is to perform a Google search on the type of product or services you are marketing. Researchers can also utilize search analytics tools like SEMrush, BuzzSumo, SpyFu, and others to identify your direct and indirect competitors.
Define Your Goals
Researchers need to identify the objective for conducting competition analysis in the first place. Identifying goals can help to plan what kind of information to collect and how to analyze it later. Some of the common objectives that researchers focus on while performing competition analysis are:
- Are you trying to improve your branding against your competitor?
- Are you aiming to improve your USP?
- Do you want to get more traffic on a particular set of keywords?
- Do you want to provide a better user experience than your competitors?
- Do you want a higher conversion rate?
Determine What Data to Collect
There are many possible data sources to collect information from, but you need to determine the relevant ones to save time and resources. Here are some of the sources to make a precise competition analysis.
- Search engine data
- Online advertising and promotion data
- Website content sources such as blog posts, eBooks, FAQs, etc.
- Social media analytics of Twitter, LinkedIn, Instagram, etc.
- Print sources such as brochures, magazine ads, flyers, etc.
- Customer data gathered from surveys, polls, interviews, etc.
- Financial reports and company profiles of customers
- Stock market data
- Market research reports
- Newspaper archives
- Online reviews
Analyze your data
After collecting insights, analyze your data according to key performance indicators (KPIs) related to your competitor analysis. For instance, if your goal is to generate more traffic than your competitors, your KPIs might include stats about traffic volume, page authority, unique backlinks, etc.
Set Up Competitor Analysis Review Process
To achieve sustainable long-term growth, you should be able to see from your KPIs the areas to improve to gain an edge over your competitor. Follow standard operating procedures while conducting a periodic review of your competitor analysis. A good way is to do periodic review is to
- Create a daily report on your company’s SEO performance versus competitors
- Review the report weekly with your marketing team
- Use a chart to track progress
- Assess monthly goals to stay on track with your annual goals
- Redefine your quarterly and monthly goals for next year
Evaluate Strengths and Weaknesses of Competitors
Using all the collected information, you can improve your business and address those aspects that require attention. Examples of strengths include focused value proposition, broader offering, lower price, quality, customer service satisfaction, high website traffic, high ranking in critical search keywords.