Forecast Period | 2026-2030 |
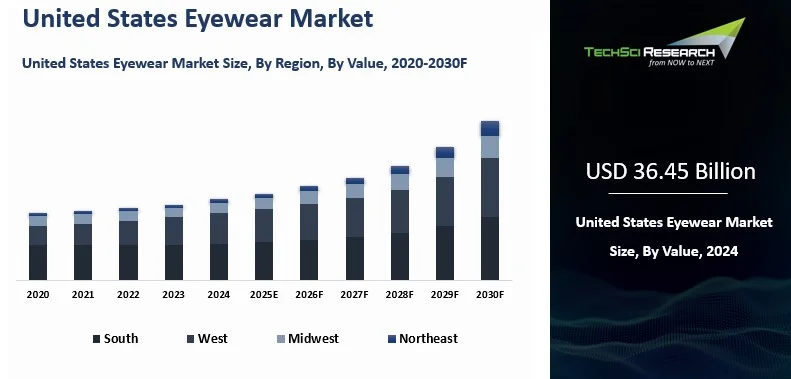
Market Size (2024) | USD 36.45 Billion |
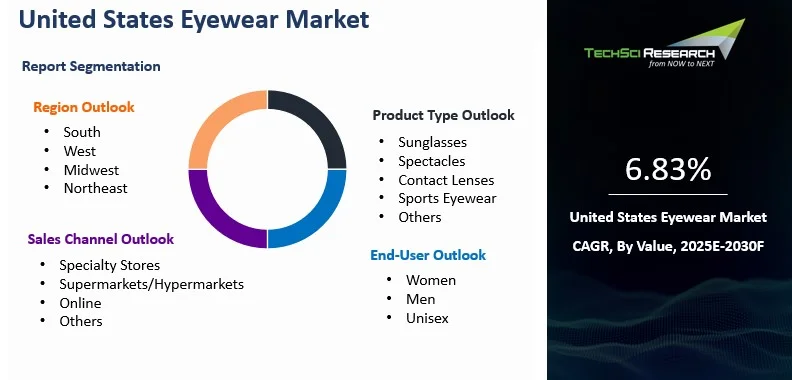
CAGR (2025-2030) | 6.83% |
Fastest Growing Segment | Online |
Largest Market | South |
Market Size (2030) | USD 54.01 Billion |
Market Overview
Eyewear Market in United States was valued at USD 36.45 billion in 2024 and is anticipated to grow USD 54.01 billion by 2030 with a CAGR of 6.83% during forecast period. The U.S. eyewear market is experiencing steady growth, propelled by several key factors. An aging population and the increasing prevalence of vision disorders are driving demand for prescription glasses, contact lenses, and reading glasses. Lifestyle changes, such as increased screen time, have heightened awareness of eye health, leading to a surge in demand for blue light-blocking lenses and other protective eyewear. Fashion trends also play a significant role, with consumers seeking stylish and designer frames as fashion accessories. Technological advancements, including the development of smart eyewear and innovations in lens materials, are further shaping the market. The rise of e-commerce platforms has made eyewear more accessible, offering consumers a wide range of options and convenience.
Key Market Drivers
Rising Prevalence of Vision Disorders and an Aging Population
One of the most significant drivers of the U.S. eyewear market is the increasing prevalence of vision-related conditions such as myopia, hyperopia, presbyopia, and astigmatism. According to the Centers for Disease Control and Prevention (CDC), millions of Americans suffer from some form of visual impairment. This growing trend is largely attributed to the aging population in the United States, as age-related eye conditions such as cataracts, glaucoma, and macular degeneration become more common among older adults.
As the Baby Boomer generation continues to age, the demand for corrective eyewear such as reading glasses, bifocals, and progressive lenses is projected to rise steadily. Many consumers are also seeking stylish and functional eyewear that addresses both vision needs and personal aesthetics. This aging demographic, combined with increased awareness of eye health, is a key growth engine for the eyewear market across retail and e-commerce channels.
Digital Eye Strain and Blue Light Awareness
In recent years, the surge in screen time due to digital devices has led to a significant increase in digital eye strain, also known as computer vision syndrome. With many Americans spending prolonged hours on smartphones, tablets, laptops, and monitors—particularly since the rise of remote work and online learning—there has been a sharp uptick in the demand for eyewear that mitigates blue light exposure.
Consumers are now more proactive in protecting their eyes from the potentially harmful effects of blue light, which has been associated with eye fatigue, headaches, and disrupted sleep cycles. As a result, eyewear brands are expanding their product lines to include blue light-blocking lenses, both in prescription and non-prescription formats. Retailers and optical brands are leveraging this trend to introduce innovative lens coatings and digital protection eyewear, appealing to both young professionals and students.
Fashion and Lifestyle Trends Driving Eyewear as a Style Accessory
Eyewear has increasingly become a fashion-forward accessory, influencing purchasing behavior beyond medical necessity. Consumers today view glasses and sunglasses as expressions of personal style, status, and identity. This shift has been amplified by celebrity endorsements, social media influencers, and collaborations between eyewear brands and luxury fashion labels.
Design-forward collections and seasonal frame releases from brands like Ray-Ban, Warby Parker, and Oakley have captured the attention of style-conscious buyers. Consumers are more willing to purchase multiple frames to suit different occasions, moods, or outfits, boosting overall market value. In addition, the rise of customization options, including frame color, shape, and engraving, allows buyers to create personalized eyewear experiences. This fashion-oriented shift has also led to a growing interest in niche and indie brands that offer unique or sustainable frames, further diversifying the competitive landscape.
Download Free Sample Report
Key Market Challenges
Intense Market Competition and Price Sensitivity
The United States eyewear market is highly competitive, with a broad mix of established global players, regional optical chains, online startups, and private-label brands all vying for consumer attention. This competitive landscape has led to significant price pressure, especially in the online space where consumers can easily compare prices across multiple retailers.
Brands such as Warby Parker and Zenni Optical have disrupted the market by offering affordable, direct-to-consumer eyewear, putting pressure on traditional brick-and-mortar optical stores. Many consumers now expect stylish, high-quality glasses at lower prices, which challenges legacy brands and retailers to maintain profitability while adapting to new pricing models.
Regulatory and Insurance Barriers
The eyewear industry in the United States is subject to complex regulatory oversight and insurance-related challenges, which can hinder both market entry and operational efficiency. Prescription eyewear, in particular, must comply with stringent optometric and healthcare regulations. Companies must navigate rules set by the FDA, HIPAA compliance for patient data, and state-level optometry boards.
One significant challenge is the restriction on online sales of certain eyewear products, especially when a valid prescription is required. Consumers often need to visit an eye care professional for an in-person eye exam before purchasing prescription glasses or contact lenses, creating friction in the customer journey—especially in the e-commerce channel.
Key Market Trends
Personalization and Customization in Eyewear
A prominent trend gaining momentum in the U.S. eyewear market is the increasing demand for personalized and customized products. Today’s consumers are no longer satisfied with one-size-fits-all solutions; they are looking for eyewear that reflects their individual style, needs, and personality. This has led to the rise of customizable frames, lens coatings, and even engraving options that allow buyers to create truly unique eyewear experiences.
Digital tools now enable customers to choose frame colors, shapes, materials, and even specific lens technologies tailored to their lifestyle such as photochromic lenses, blue light filters, or polarized sunglasses. Companies like Warby Parker and Zenni Optical have successfully integrated customization features into their online platforms, providing virtual try-ons and personalized recommendations based on facial recognition and fashion preferences. This level of personalization not only enhances customer satisfaction but also boosts brand loyalty and repeat purchases.
Growth of Sustainable and Eco-Friendly Eyewear
Sustainability has become a key focus across many consumer goods industries, and eyewear is no exception. In the United States, environmentally conscious consumers are increasingly choosing brands that prioritize eco-friendly materials and sustainable manufacturing practices. As a result, there has been a surge in eyewear collections made from biodegradable acetate, recycled metals, ocean plastics, and plant-based materials.
Brands like Proof Eyewear, Pela Vision, and Sea2See have built strong followings by emphasizing transparency, ethical sourcing, and minimal environmental impact. Even larger players such as Ray-Ban and Oakley have launched sustainability-focused product lines in response to consumer expectations.
Integration of Smart Eyewear and Wearable Technology
The convergence of eyewear and technology is another transformative trend in the market. Smart eyewear, which includes features such as voice assistance, audio playback, AR overlays, and fitness tracking, is increasingly being adopted in the U.S., particularly among tech-savvy users and early adopters. Major tech companies, including Meta, Amazon, and Google, have entered the space with products like Ray-Ban Meta Smart Glasses and Amazon Echo Frames.
While still a niche segment compared to traditional eyewear, smart glasses are gaining attention due to their multifunctionality and the growing demand for wearable tech. Consumers are drawn to the ability to stay connected, listen to music, or navigate hands-free, all while wearing stylish frames. As battery life, comfort, and visual aesthetics improve, smart eyewear is likely to become a more mainstream offering over the next few years.
Segmental Insights
Product Type Insights
Sunglasses represent the dominating segment in the United States eyewear market, driven by strong consumer demand for fashion-forward designs, UV protection, and seasonal versatility. The segment benefits from widespread usage across all age groups and consistent adoption as both a style accessory and a functional product. High brand visibility, celebrity endorsements, and frequent product launches contribute to sustained growth. Additionally, increasing awareness of eye health and harmful UV exposure has encouraged more consumers to invest in quality sunglasses. The segment's broad appeal, rapid trend cycles, and availability across both luxury and budget tiers further reinforce its leading market position.
Sales Channel Insights
Supermarkets and hypermarkets hold the dominating position in the United States eyewear market due to their wide accessibility, convenience, and competitive pricing. These retail formats offer a broad range of eyewear products, including reading glasses, sunglasses, and non-prescription frames, catering to diverse consumer needs. Their high foot traffic and strategic in-store placement allow for impulse purchases and seasonal promotions, enhancing sales volume. Additionally, partnerships with eyewear brands and in-house optical centers enable them to provide affordable, quick solutions for everyday eyewear. The one-stop-shop experience, combined with trusted retail environments, makes supermarkets and hypermarkets a preferred eyewear purchasing channel.
Download Free Sample Report
Regional Insights
The South was the dominating region in the United States eyewear market, driven by its large population, strong retail presence, and growing awareness of eye health. States like Texas and Florida contribute significantly due to their warm climates, where sunglasses are in high demand year-round. Additionally, the region’s diverse demographics and increasing urbanization fuel demand for both prescription and fashion eyewear. The expansion of optical retail chains and availability of affordable eyewear in supermarkets and drugstores further support market growth. High consumer spending, rising disposable incomes, and an inclination toward branded eyewear strengthen the South’s leading position in the market.
Recent Developments
- In April 2025, EssilorLuxottica launched its Nuance Audio Glasses in the U.S. at a launch event in New York City. These glasses integrate open-ear hearing technology into stylish eyewear, offering a discreet solution for individuals with mild-to-moderate hearing loss.
- In Feb 2025, Von Miller and GlassesUSA.com have partnered to launch an AI-designed eyewear collection, blending athletic inspiration with cutting-edge technology. The collection features frames crafted using artificial intelligence to ensure optimal fit and style.
- In July 2024, GlassesUSA.com introduced "Pairfect Match AI," an innovative tool that leverages rtificial intelligence to recommend eyewear tailored to individual facial features and style preferences. This advancement enhances the online shopping experience, enabling customers to find the perfect pair of glasses from over 10,000 available styles.
Key Market Players
- EssilorLuxottica SA
- Bausch Health Companies Inc.
- Johnson & Johnson Vision Care, Inc.
- Alcon Vision LLC
- The Cooper Companies, Inc.
- Safilo USA, Inc.
- Menicon America, Inc.
- Hoya Vision Care
- Carl Zeiss Vision Inc.
- Zenni Optical, Inc.
By Product Type | By End-User | By Sales Channel | By Region |
- Sunglasses
- Spectacles
- Contact Lenses
- Sports Eyewear
- Others
| | - Specialty Stores
- Supermarkets/Hypermarkets
- Online
- Others
| - South
- West
- Midwest
- Northeast
|
Report Scope:
In this report, the United States Eyewear Market has been segmented into the following categories, in addition to the industry trends which have also been detailed below:
- United States Eyewear Market, By Product Type:
o Sunglasses
o Spectacles
o Contact Lenses
o Sports Eyewear
o Others
- United States Eyewear Market, By End-User:
o Women
o Men
o Unisex
- United States Eyewear Market, By Sales Channel:
o Specialty Stores
o Supermarkets/Hypermarkets
o Online
o Others
- United States Eyewear Market, By Region:
o South
o West
o Midwest
o Northeast
Competitive Landscape
Company Profiles: Detailed analysis of the major companies presents in the United States Eyewear Market.
Available Customizations:
United States Eyewear Market report with the given market data, TechSci Research offers customizations according to a company's specific needs. The following customization options are available for the report:
Company Information
- Detailed analysis and profiling of additional market players (up to five).
United States Eyewear Market is an upcoming report to be released soon. If you wish an early delivery of this report or want to confirm the date of release, please contact us at sales@techsciresearch.com