|
Key Insights
|
Details
|
|
Forecast Period
|
2027-2031
|
|
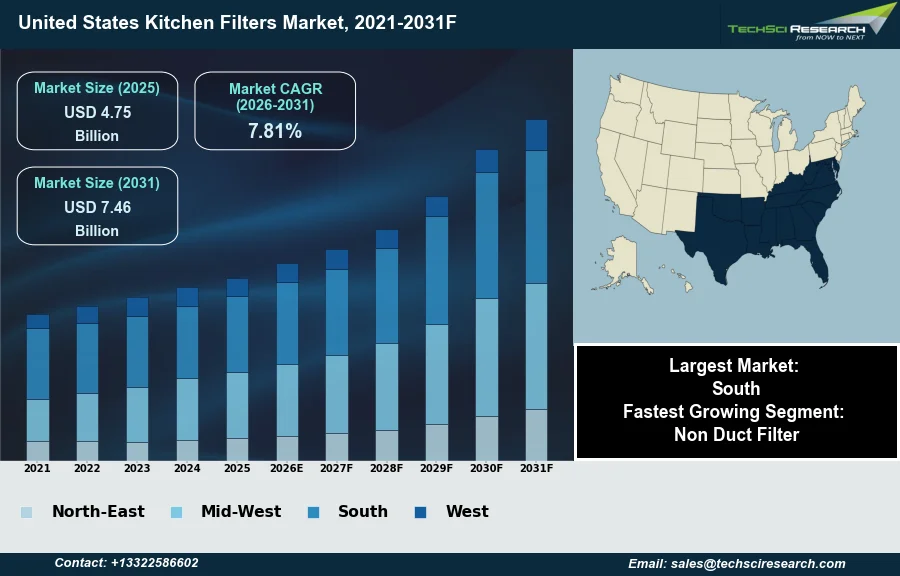
Market Size (2025)
|
USD 4.75 Billion
|
|
CAGR (2026-2031)
|
7.81%
|
|
Fastest Growing Segment
|
Non Duct Filter
|
|
Largest Market
|
South
|
|
Market Size (2031)
|
USD 7.46 Billion
|
Market Overview
The United States Kitchen Filters Market will grow from USD 4.75 Billion in 2025 to USD 7.46 Billion by 2031 at a 7.81% CAGR. The United States kitchen filters market encompasses a range of filtration components designed to enhance air and water quality within residential and commercial kitchen environments, including those integrated into range hoods for grease and odor removal, and under-sink systems for water purification. Key market growth drivers include heightened consumer awareness of indoor air quality and water purity concerns, alongside increasingly stringent building codes mandating effective ventilation. Furthermore, the robust activity in both new construction and renovation sectors, coupled with a rising demand for energy-efficient kitchen appliances, propels market expansion. According to the National Kitchen & Bath Association, the broader kitchen and bath industry in the U.S. is projected to generate $235 billion in revenue for 2025, reflecting a modest 0.8% growth compared to the preceding year.
A significant challenge impeding market expansion is the substantial initial cost associated with advanced kitchen filtration systems, which often includes complex installation procedures and specialized maintenance requirements. These factors can present a barrier to adoption for budget-conscious consumers and smaller commercial establishments.
Key Market Drivers
Rising Health and Safety Concerns Drive Kitchen Filtration Demand
Heightened consumer health and safety concerns are significantly driving demand within the United States kitchen filters market. As awareness grows regarding the presence of contaminants in both tap water and indoor air, households are increasingly investing in filtration solutions to safeguard well-being. This rising apprehension is evident in recent findings. According to the Water Quality Association's 2025 Consumer Insights Report, 58% of U.S. households express concern about the safety of their tap water, prompting many to seek out purification systems for drinking and cooking. This proactive stance by consumers directly translates into greater adoption of under-sink water filters, whole-house filtration units, and advanced range hood systems designed to capture grease and airborne particulates, thereby improving overall kitchen hygiene and air quality.
Stricter Regulations Accelerate Filtration Market Growth
Stricter regulatory standards for water and air quality further bolster market expansion by mandating enhanced filtration. Government agencies are consistently updating guidelines to reduce exposure to harmful substances, directly influencing product design and installation requirements for kitchen environments. For instance, in January 2026, the Water Quality Association highlighted that under the Lead and Copper Rule implementation, public water supplies are required to provide homeowners with certified lead filters and replacement cartridges if a service line is disturbed. These types of regulations compel both new construction and renovation projects to incorporate more effective and compliant filtration systems. This regulatory push, coupled with broader industry trends, contributes to the market's growth. According to the Association of Home Appliance Manufacturers, in the first quarter of 2025, U.S. shipments of cooking appliances, which often integrate filtration, saw a 9.6% increase compared to the same period in the previous year.
Download Free Sample Report
Key Market Challenges
High upfront costs and complexity hinder market adoption
The substantial initial cost associated with advanced kitchen filtration systems, coupled with complex installation procedures and specialized maintenance requirements, presents a significant impediment to market expansion. These financial barriers directly limit the widespread adoption of sophisticated air and water purification technologies across both residential and commercial kitchen environments. Such high upfront investment costs deter potential customers, regardless of the long-term benefits in enhancing indoor air quality and water purity.
Affordability focus constrains market penetration and revenue potential
This challenge particularly compels budget-conscious consumers and smaller commercial establishments to prioritize affordability, often at the expense of comprehensive filtration solutions. For example, according to the National Kitchen & Bath Association, in the first quarter of 2025, two-thirds (68%) of surveyed kitchen and bath firms observed that consumers either maintained product quality or opted for lower-grade products during renovation planning. This consumer behavior directly constrains the market penetration and overall revenue potential of advanced kitchen filters in the United States.
Key Market Trends
Rise of Connected Smart Filtration in U.S. Kitchens
The increasing integration of smart filtration systems represents a pivotal trend reshaping the United States kitchen filters market. These intelligent systems leverage advanced connectivity, such as Wi-Fi and artificial intelligence, to offer enhanced control, monitoring, and efficiency beyond traditional filtration methods. For instance, smart range hoods can automatically adjust fan speeds based on cooking intensity, while smart water filters can provide real-time water quality data and predict filter replacement needs. This shift towards interconnected kitchen ecosystems emphasizes convenience and optimized performance for consumers. According to the IEEE IoT Journal's 2025 longitudinal study of 12,400 homes, on-device AI in smart appliances can significantly reduce Wide Area Network bandwidth use by 73%.
Growing Adoption of Sustainable and Recyclable Filters
Another significant trend influencing the market is the growing adoption of sustainable filter solutions. As environmental consciousness rises among consumers, there is a distinct preference for products that minimize ecological impact throughout their lifecycle, from manufacturing to disposal. This trend is driving innovation in filter materials, design for recyclability, and energy-efficient operation of filtration systems. Manufacturers are responding by developing filters made from biodegradable or recyclable components and designing systems that promote water and energy conservation. This aligns with broader consumer purchasing values; according to Real Simple, May 10, 2025, 68% of brands are now selling products made from recycled materials in response to increased consumer demand.
Segmental Insights
Non-Ducted Kitchen Filters: Growth Driven by Flexible Installation and Advanced Filtration Technologies
In the United States Kitchen Filters Market, the non-duct filter segment is experiencing rapid growth, driven primarily by evolving residential needs and technological advancements. This acceleration is attributed to the inherent flexibility and ease of installation that non-ducted systems offer, particularly advantageous in urban environments, apartments, and existing structures where complex external ductwork is often impractical or costly to implement. Furthermore, ongoing innovations in filtration technology, including advanced charcoal and plasma filters, significantly enhance the ability of these systems to effectively capture grease, odors, and airborne pollutants, thereby improving indoor air quality without requiring external venting. This combination of simplified integration and enhanced performance caters to a growing consumer preference for efficient, adaptable, and aesthetically compatible kitchen ventilation solutions.
Regional Insights
Growth-Driven Demand for Kitchen Filters in the Southern United States
The Southern United States holds a dominant position in the kitchen filters market, primarily driven by the region's robust economic growth and considerable population expansion. This expansion fuels significant new residential construction, where modern kitchen designs frequently incorporate advanced built-in appliances and ventilation systems requiring effective filtration. These newer homes comply with current building codes and environmental regulations, emphasizing efficient kitchen ventilation and air quality. Furthermore, increasing industrialization and population growth in the South contribute to a substantial demand for pure drinking water, consequently boosting the adoption of kitchen water filtration systems.
Recent Developments
-
In October 2025, a collaborative research project funded by a National Science Foundation grant and led by Washington University in St. Louis, in partnership with the University of Illinois, commenced the development of novel technology for water safety. The research focuses on analyzing spent point-of-use water filters, such as those found in kitchen faucets or pitchers, to identify contaminants trapped during their lifespan. This breakthrough research aims to enable households in the United States to monitor their drinking water quality effectively. The initiative seeks to develop a coordinated testing and support program, with the potential to establish a startup or nonprofit to offer these services nationwide.
-
In June 2025, iSpring Water Systems showcased a new product innovation at the Water Quality Association (WQA) Convention & Exposition: an upgraded countertop Reverse Osmosis (RO) system, model RCD100SPKHC. This forthcoming system is designed to integrate instant hot and cold water dispensing with a built-in soda maker, offering enhanced convenience for households in the United States. The introduction reflects iSpring's ongoing investment in research and development to address evolving consumer needs for advanced water filtration in the kitchen. The system features multiple temperature settings and volume options, aiming to provide versatile and high-quality filtered water solutions.
-
In October 2024, Grease Guardian USA announced the availability of its Automatic Grease Removal Devices on Amazon US, alongside plans to expand its product offerings in 2025 to include essential food filters for commercial kitchens. This strategic move marks an expansion of the company’s presence in the United States kitchen filter market, targeting a broader range of grease and food management solutions. The introduction of food filters aims to improve filtration efficiency, maintain food quality, and reduce waste within commercial kitchen operations. This initiative underscores a commitment to providing comprehensive solutions for kitchen hygiene and operational efficiency.
-
In March 2024, Brita introduced its Elite Chrome Faucet Water Filter System, expanding its range of kitchen water filtration solutions in the United States. This new faucet-mounted system incorporates advanced carbon-block technology, designed to significantly reduce chlorine taste and odor, along with over 60 contaminants, including 99% of lead. The system offers convenience with two spray options and features a filter indicator to signal replacement, typically every four months or after 100 gallons. This product launch provides consumers with an accessible option for obtaining filtered water directly from their kitchen faucets, aiming to enhance the quality of tap water for drinking and cooking.
Key Market Players
- Broan-NuTone LLC
- Whirlpool Corporation
- Vent-A-Hood Company
- Electrolux AB
- Zephyr Ventilation, LLC
- Transform Holdco LLC
- Viking Range, LLC
- Elica S.p.A
- Faber Usa And Canada
- Thermador Corporation
|
By Region
|
- Northeast
- Midwest
- South
- West
|
Report Scope:
In this report, the United States Kitchen Filters Market has been segmented into the following categories, in addition to the industry trends which have also been detailed below:
-
United States Kitchen Filters Market, By Region:
-
Northeast
-
Midwest
-
South
-
West
Competitive Landscape
Company Profiles: Detailed analysis of the major companies present in the United States Kitchen Filters Market.
Available Customizations:
United States Kitchen Filters Market report with the given market data, TechSci Research offers customizations according to a company's specific needs. The following customization options are available for the report:
Company Information
- Detailed analysis and profiling of additional market players (up to five).
United States Kitchen Filters Market is an upcoming report to be released soon. If you wish an early delivery of this report or want to confirm the date of release, please contact us at sales@techsciresearch.com