|
Key Insights
|
Details
|
|
Forecast Period
|
2027-2031
|
|
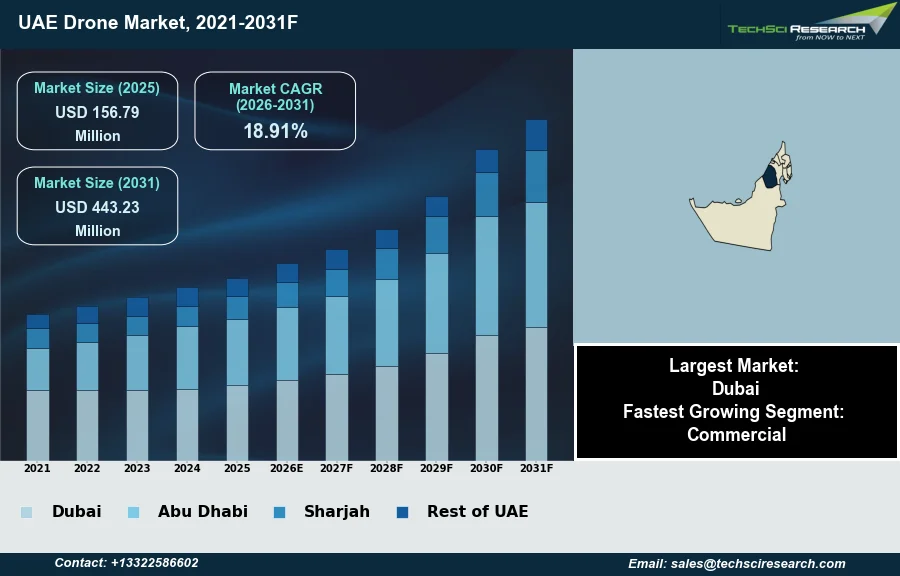
Market Size (2025)
|
USD 156.79 Million
|
|
CAGR (2026-2031)
|
18.91%
|
|
Fastest Growing Segment
|
Commercial
|
|
Largest Market
|
Dubai
|
|
Market Size (2031)
|
USD 443.23 Million
|
Market Overview
The UAE Drone Market will grow from USD 156.79 Million in 2025 to USD 443.23 Million by 2031 at a 18.91% CAGR. The UAE drone market comprises Unmanned Aerial Vehicles (UAVs) deployed across various sectors for critical operations including surveillance, inspection, logistics, and data acquisition. The market's growth is primarily propelled by robust governmental support and a progressive regulatory environment. According to the General Civil Aviation Authority, as of January 2025, 23,960 drones were registered in the country, demonstrating substantial market engagement. Main drivers include the nation's strategic emphasis on smart city development, integrating autonomous aerial systems into urban planning, alongside significant investments in infrastructure projects necessitating advanced aerial monitoring capabilities.
Continued military modernization initiatives and the ongoing transformation of logistics through innovative aerial delivery mechanisms also contribute to market expansion. Nevertheless, a notable challenge that could hinder market growth is the inherent complexity and evolving nature of regulatory compliance, requiring continuous adaptation from commercial operators to navigate intricate permit requirements and operational guidelines effectively.
Key Market Drivers
Policy Support and Evolving Regulation
The UAE drone market is significantly influenced by supportive government policies and an evolving regulatory framework. Authorities across the Emirates continue to implement strategies aimed at integrating Unmanned Aerial Vehicles into various public services and defense initiatives. This commitment is evidenced by substantial governmental investments and strategic procurements. For instance, according to The Filipino Times, in November 2025, the UAE Ministry of Defence and Abu Dhabi Police finalized a Dh76 million drone procurement with Abu Dhabi Autonomous Systems Investments (ADASI) as part of broader defense deals. Such expenditures underscore a national intent to leverage drone technology for enhancing security and operational capabilities. The ongoing adjustments to regulatory frameworks, despite periods of heightened restrictions, consistently aim to establish clear guidelines for advanced drone operations, fostering an environment for safe innovation and deployment in specific approved contexts.
UAV Integration into Public Services and Defense
Diversified commercial and industrial applications further contribute to the expansion of the UAE drone market. Drones are increasingly adopted across critical sectors for tasks such as infrastructure inspection, logistics, environmental monitoring, and security. The utility of drones in maintaining public safety is exemplified by the Dubai Police deploying nine drones as part of a back-to-school safety operation in August 2025, according to Arabian Business. This showcases the practical integration of aerial systems for surveillance and rapid response. Furthermore, broader governmental initiatives indicate a substantial financial commitment to modernizing security infrastructure with drone capabilities. According to DRN Real Estate, in November 2024, Dubai invested $545 million in innovative police projects, many of which involve advanced drone technology. These applications demonstrate the market's progression beyond traditional uses into specialized operational roles across multiple industries.
Download Free Sample Report
Key Market Challenges
GCAA Nationwide Drone Ban and Regulatory Uncertainty
The most significant challenging factor currently impacting the UAE drone market is the evolving nature of regulatory compliance, which has culminated in a nationwide operational ban. The General Civil Aviation Authority (GCAA) imposed a comprehensive ban on all drone flights, including both commercial and recreational unmanned aerial vehicles, in March 2026 due to airspace-security conditions.
Impact of the Ban on Operations, Growth, and Investment
This blanket prohibition directly obstructs market growth by halting all operational activities. Commercial entities, unable to conduct surveillance, inspection, logistics, or data acquisition missions, face complete disruption to their service offerings and revenue streams. According to the GCAA, this ban has suspended all existing operating permits and prevents the issuance of new approvals, thus eliminating any immediate prospects for market expansion or new business development in the sector. The uncertainty surrounding the duration and conditions for lifting this ban deters potential investment and stifles innovation within the industry.
Key Market Trends
AI-Driven Autonomy and Real-Time Data Analytics in UAE Drones
The integration of artificial intelligence and machine learning into drone operations is profoundly transforming the UAE drone market by enhancing autonomy, data analysis, and operational efficiency across sectors. This trend moves beyond basic remote control, enabling drones to perform complex tasks such as predictive maintenance, environmental monitoring, and intelligent surveillance with minimal human intervention. AI algorithms allow drones to process vast amounts of aerial data in real-time, identifying anomalies, assessing conditions, and optimizing flight paths for greater precision. For example, according to The National News, May 2026, reporting on the "2026 Microsoft AI Economy Institute analysis", the UAE achieved a 70.1 percent AI diffusion score, highlighting the nation's widespread adoption of AI tools that are increasingly integrated into drone technology. This advancement supports the UAE's vision for smart cities and contributes to diverse applications, from agricultural analysis to infrastructure inspection.
Urban Air Mobility Expansion and Aerial Infrastructure
Another significant trend is the expansion of Urban Air Mobility (UAM), which envisions drones and electric vertical take-off and landing (eVTOL) aircraft transforming urban transportation and logistics. This involves developing dedicated aerial corridors, vertiports, and regulatory frameworks to facilitate passenger and cargo services within cities. The UAE is actively pursuing UAM to alleviate traffic congestion and establish innovative mobility solutions. This commitment is evidenced by substantial infrastructure development. According to the Abu Dhabi Investment Office, November 2025, it launched a vertiport network featuring over 10 state-of-the-art vertiports to support the activation of air taxi operations in Abu Dhabi, marking a major step towards integrating advanced aerial mobility into the emirate's transport system. These initiatives position the UAE as a pioneering hub for future urban air travel and drone delivery services.
Segmental Insights
Smart-city initiatives and regulatory framework propel UAE commercial drone market growth
The commercial segment is rapidly expanding in the UAE drone market, driven by the nation's ambitious smart city initiatives and widespread adoption across diverse industries. The integration of drones into sectors such as construction, logistics, infrastructure inspection, and precision agriculture is significantly enhancing operational efficiency and data collection capabilities. Supportive government regulations from entities like the General Civil Aviation Authority (GCAA) and the Dubai Civil Aviation Authority (DCAA) provide a structured framework for safe and compliant commercial operations, fostering an environment conducive to innovation and investment in advanced aerial systems. This strategic alignment between technological advancements and regulatory support underpins the segment's robust growth.
Regional Insights
Dubai's regulatory framework and urban initiatives drive UAE drone market leadership
Dubai firmly leads the UAE Drone Market, primarily driven by its progressive regulatory environment and strategic government support. The Dubai Civil Aviation Authority (DCAA) has been instrumental in establishing a framework, including Dubai Law No. 4 of 2020, to enable a wider scope of commercial drone operations and foster innovation. This is further enhanced by Dubai's ambitious smart city initiatives and significant investment in urban infrastructure, which actively integrates drone technology for diverse applications. The emirate’s concentration of e-commerce, technology companies, and key logistics hubs creates an optimal ecosystem, encouraging widespread drone adoption across sectors such as construction, surveillance, and traffic management.
Recent Developments
-
In November 2025, a significant collaboration emerged within the UAE drone market as the Emirati state-owned defense conglomerate, EDGE Group, partnered with US military technology company Anduril. This joint venture, announced in Abu Dhabi, focused on designing and producing AI-powered autonomous drones. The partnership included plans to develop a new model called the "Omen drone" at a dedicated research facility in the capital. EDGE Group committed nearly $200 million towards the project, and the UAE committed to acquiring the initial 50 units of the Omen drone, which is designed for robust performance in various operational scenarios.
-
In November 2025, ADNOC, in collaboration with the Technology Innovation Institute (TII) and ASPIRE, launched a breakthrough research project involving autonomous drones for emergency response. This initiative aimed to enhance crisis management across critical energy infrastructure throughout the UAE. The pilot project involved testing fleets of autonomous drones, including coordinated drone swarms, to provide real-time situational awareness to ADNOC’s Crisis Management Center during industrial emergencies. This strategic development underscored the integration of artificial intelligence into critical operational safety measures within the UAE drone market.
-
In February 2025, Advanced Integrated Technology (AIT), a UAE-based subsidiary of Streit Group, introduced a new product, the Sea Drone, at IDEX 2025. This quadcopter drone was specifically engineered for challenging environmental conditions prevalent in the UAE, including adverse weather, salt fog, and fine dust, with the unique capability to land on water. The Sea Drone offers customizable payloads for diverse applications such as security operations, coastal monitoring, and disaster response. Its launch significantly contributed to expanding specialized drone solutions available within the UAE drone market for both civilian and security sectors.
-
In February 2025, ADASI, a prominent UAE-based unmanned aerial vehicle (UAV) systems manufacturer, announced the adoption of two advanced autonomous flight technologies: Saluki and Perceptra. Developed by the Technology Innovation Institute (TII) and VentureOne, these technologies were unveiled at IDEX 2025. Saluki provides high-security flight control, while Perceptra enables reliable navigation without GPS, crucial for operations in challenging environments. ADASI's integration of these innovations aimed to enhance the security, resilience, and precision of its autonomous aerial platforms, strengthening the technological capabilities within the broader UAE drone market.
Key Market Players
- Gulf Drones
- Falcon Eye Drones
- AeroX
- SkyGo UAE
- Drone Services UAE
- DJI UAE
- Parrot UAE
- Autel Robotics UAE
- XAG UAE
- Yuneec UAE
|
By Type
|
By End User
|
By Application
|
By Region
|
- TUAV
- HALE
- MALE
- VTOL
- Fixed Wings
- and Others
|
|
- Mapping
- Surveying & Photography
- Security
- Others
|
- Dubai
- Abu Dhabi
- Sharjah
- Rest of UAE
|
Report Scope:
In this report, the UAE Drone Market has been segmented into the following categories, in addition to the industry trends which have also been detailed below:
-
UAE Drone Market, By Type:
-
TUAV
-
HALE
-
MALE
-
VTOL
-
Fixed Wings
-
and Others
-
UAE Drone Market, By End User:
-
UAE Drone Market, By Application:
-
Mapping
-
Surveying & Photography
-
Security
-
Others
-
UAE Drone Market, By Region:
-
Dubai
-
Abu Dhabi
-
Sharjah
-
Rest of UAE
Competitive Landscape
Company Profiles: Detailed analysis of the major companies present in the UAE Drone Market.
Available Customizations:
UAE Drone Market report with the given market data, TechSci Research offers customizations according to a company's specific needs. The following customization options are available for the report:
Company Information
- Detailed analysis and profiling of additional market players (up to five).
UAE Drone Market is an upcoming report to be released soon. If you wish an early delivery of this report or want to confirm the date of release, please contact us at sales@techsciresearch.com