|
Key Insights
|
Details
|
|
Forecast Period
|
2027-2031
|
|
Market Size (2025)
|
USD 9.95 Billion
|
|
CAGR (2026-2031)
|
4.12%
|
|
Fastest Growing Segment
|
Electric
|
|
Largest Market
|
Eastern
|
|
Market Size (2031)
|
USD 12.68 Billion
|
Market Overview
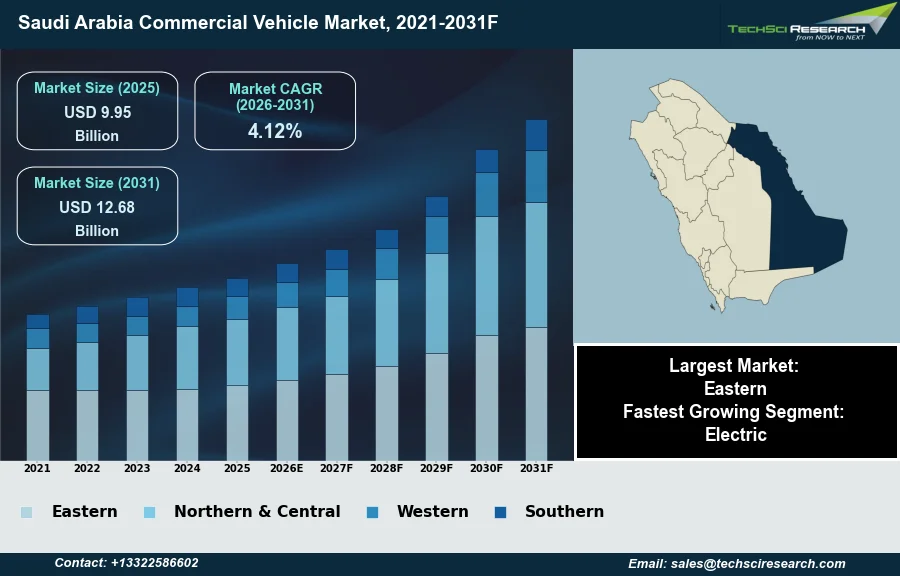
The Saudi Arabia Commercial Vehicle Market will grow from USD 9.95 Billion in 2025 to USD 12.68 Billion by 2031 at a 4.12% CAGR. The Saudi Arabia Commercial Vehicle Market encompasses motor vehicles primarily designed for transporting goods, passengers, or services that generate income, including various types of trucks, vans, and buses. Market expansion is substantially driven by the nation's ambitious Vision 2030 initiatives, which involve large-scale infrastructure development and mega-projects. Further impetus stems from the burgeoning logistics and e-commerce sectors, which necessitate efficient transportation solutions for growing demand. Economic diversification and industrial growth beyond the oil sector also contribute to increasing fleet requirements.
According to the International Organization of Motor Vehicle Manufacturers (OICA), commercial vehicle sales in Saudi Arabia totaled 99,507 units in 2024. A significant challenge impeding market growth is the high acquisition and maintenance costs associated with advanced and environmentally compliant vehicles, particularly for smaller businesses.
Key Market Drivers
Infrastructure Growth Driving Commercial Vehicle Demand
Large-scale infrastructure development projects significantly drive the Saudi Arabia Commercial Vehicle Market. The nation's Vision 2030 framework powers numerous mega-projects, demanding extensive fleets of heavy-duty trucks and specialized transport. These initiatives, including new cities and advanced transportation networks, require considerable material and equipment movement. According to the Infrastructure Sector 2025 White Paper, in February 2025, municipal infrastructure allocation in Saudi Arabia is projected to increase to $21.3 billion. Such investments directly boost commercial vehicle procurement supporting ongoing construction and new economic hubs.
E-commerce Growth and Domestic Manufacturing Reshape CV Supply
The rapid expansion of e-commerce and logistics sectors also significantly influences the commercial vehicle market. Growing online retail penetration and consumer demand for expedited delivery services boost the need for light and medium commercial vehicles, especially for last-mile operations. This necessitates efficient transportation solutions and investment in modern logistics infrastructure. According to a statistical bulletin issued by the Saudi Central Bank (SAMA), in December 2025, an Arab News article reported e-commerce sales via Mada cards in Saudi Arabia surged 68 percent year-on-year in October 2025, reaching over SAR 30.7 billion. This growth highlights the increasing reliance on robust commercial vehicle fleets. Additionally, to enhance local industrial capabilities, according to the Saudi Press Agency (SPA), in 2025, the Kingdom secured an investment exceeding $500 million for a Hyundai Motor Company manufacturing plant, slated to produce 50,000 vehicles annually. This strategic focus on domestic production will alter the commercial vehicle supply landscape.
Download Free Sample Report
Key Market Challenges
High Costs Impede Growth and Fleet Modernization in Saudi Arabia’s Commercial Vehicle Market
The high acquisition and maintenance costs associated with advanced and environmentally compliant vehicles present a significant impediment to the growth of the Saudi Arabia Commercial Vehicle Market. These elevated expenditures disproportionately affect smaller businesses, limiting their capacity to invest in modern fleet upgrades. Such financial barriers slow the adoption of newer, more efficient, and often greener vehicles, as businesses struggle to justify the initial outlay and ongoing operational expenses. According to the International Organization of Motor Vehicle Manufacturers (OICA), in 2023, commercial vehicle sales in Saudi Arabia totaled 113,068 units. The substantial costs deter businesses from replacing older fleets, leading to delayed modernization and a reduced market turnover for new vehicle sales, thereby stifling overall market expansion. This particularly impacts the integration of next-generation commercial vehicles which, despite long-term operational benefits, require a higher initial capital expenditure that many local enterprises find prohibitive.
Key Market Trends
Electrification of Public Transit and EV Adoption
Electrification and sustainable mobility adoption are gaining significant traction within the Saudi Arabia Commercial Vehicle Market as the Kingdom advances its environmental objectives. This trend is evident in the burgeoning deployment of electric buses across urban centers, signifying a strategic pivot towards cleaner public and commercial transport solutions. For instance, in May 2025, Tabuk inaugurated a new public bus transit system where electric buses constituted 25% of the new fleet, marking the nation's first integration of electric buses into a full-scale public network. This initiative not only reduces carbon emissions but also establishes a framework for broader electric vehicle integration in commercial fleets, supported by expanding charging infrastructure and government incentives aimed at fostering a sustainable transportation ecosystem.
Telematics and Fleet Digitization in Saudi Logistics
Concurrently, advanced telematics and fleet management integration represents another pivotal trend reshaping the Saudi commercial vehicle landscape. Businesses are increasingly adopting these technologies to optimize logistics, enhance operational efficiency, and improve driver safety. The strategic importance of this trend is highlighted by the substantial commitment towards digitizing the logistics sector, directly impacting commercial fleet operations. According to the September 2025 news article 'Saudi Logistics Go Smart with $100B Investment', a staggering $100 billion has been allocated under the ambitious Vision 2030 initiative to power Saudi logistics digitization, reimagining the supply chain infrastructure. This significant investment is driving the deployment of real-time tracking, predictive maintenance, and route optimization systems, enabling fleet operators to gain unprecedented visibility and control over their assets and operations, thereby fostering a more connected and efficient transportation network across the Kingdom.
Segmental Insights
Saudi Policy and Infrastructure Drive Electric Commercial Fleet Growth
The Electric segment is emerging as the fastest-growing component within the Saudi Arabia Commercial Vehicle Market, primarily driven by the Kingdom's overarching Vision 2030 goals and the Saudi Green Initiative. These national strategies emphasize economic diversification and a significant reduction in carbon emissions. The rapid expansion is further propelled by robust government support, which includes financial incentives, tax relief, and exemptions aimed at encouraging commercial fleets to adopt electric vehicles. Moreover, mandates such as the target for 30% electric vehicle penetration in Riyadh by 2030, supported by entities like the Ministry of Transport and Logistic Services, are accelerating fleet electrification across various sectors. Concurrently, strategic investments in developing an extensive charging infrastructure and the inherent advantages of lower operating and maintenance costs associated with electric commercial vehicles are making them increasingly attractive for businesses prioritizing sustainability and efficiency.
Regional Insights
Eastern Province as a Key Driver of the Saudi Commercial Vehicle Market
The Eastern Province consistently leads the Saudi Arabia Commercial Vehicle Market due to its significant concentration of industrial and energy-related activities. This region is central to the nation's oil and gas sector, hosting major operations of entities like Saudi Aramco and pivotal oil fields. Furthermore, it is home to large industrial cities such as Jubail Industrial City and several industrial estates overseen by the Saudi Authority for Industrial Cities and Technology Zones (MODON), which drive substantial demand for commercial vehicles in manufacturing, construction, and transportation of goods. The presence of key ports, including King Abdulaziz Port in Dammam, also positions the Eastern Province as a vital logistics hub, necessitating extensive commercial vehicle fleets for cargo movement and distribution.
Recent Developments
-
In October 2025, Dongfeng Commercial Vehicles, in collaboration with Dongfeng Import and Export Company, launched three new models tailored for the Saudi market in Riyadh, Saudi Arabia. The new lineup included the DONGFENG KL tractor, DONGFENG KC mixer truck, and DONGFENG KC dump truck. This product launch underscored Dongfeng Motor's strategic commitment to enhancing its presence and supporting the modernization of the region's transport and logistics industries. The vehicles feature upgraded technology optimized for local operating conditions, focusing on power, reliability, and fuel efficiency.
-
In June 2025, Victory Saudi Arabia introduced its 2026 next-generation 2-ton diesel commercial trucks at an event in Riyadh. These new Victory J models, developed in partnership with dealer Motiat Alkhair, feature fuel-efficient 4-cylinder engines and contemporary designs. The launch aimed to cater to Saudi Arabia's evolving transportation needs, supporting national objectives for lower emissions and long-term reliability. These trucks are specifically targeted at logistics firms, businesses, and independent operators across the Kingdom.
-
In November 2024, Tata Motors launched its first AMT (Automated Manual Transmission) truck, the Prima 4440.S, in Saudi Arabia at the Heavy Equipment and Truck (HEAT) Show. This new tractor model is powered by a 400 bhp Euro-V engine and targets heavy-duty transport applications within the Saudi Arabian commercial vehicle market. The introduction of this vehicle aimed to provide enhanced efficiency and improved driver comfort for operations in the Kingdom.
-
In June 2024, FAMCO KSA (Al-Futtaim Auto and Machinery Company) established a distribution alliance with Ashok Leyland to enhance the penetration of buses and trucks across Saudi Arabia. This collaboration aimed to strengthen the availability and support for Ashok Leyland's commercial vehicle range within the Kingdom. The partnership is strategically positioned to meet the increasing demand for various commercial transport solutions driven by Saudi Arabia's ongoing infrastructure developments and economic expansion under Vision 2030.
Key Market Players
- Mercedes-Benz Trucks KSA
- Volvo Trucks KSA
- MAN Truck KSA
- Scania KSA
- DAF KSA
- Iveco KSA
- Al Futtaim CV
- Al Naboodah CV
- United Motors CV
- Bin Laden CV
|
By Propulsion
|
By Vehicle Type
|
By Region
|
|
|
- Light Commercial Vehicle
- Medium Commercial Vehicle
- Heavy Commercial Vehicle
|
- Eastern
- Northern & Central
- Western
- Southern
|
Report Scope:
In this report, the Saudi Arabia Commercial Vehicle Market has been segmented into the following categories, in addition to the industry trends which have also been detailed below:
-
Saudi Arabia Commercial Vehicle Market, By Propulsion:
-
Saudi Arabia Commercial Vehicle Market, By Vehicle Type:
-
Light Commercial Vehicle
-
Medium Commercial Vehicle
-
Heavy Commercial Vehicle
-
Saudi Arabia Commercial Vehicle Market, By Region:
-
Eastern
-
Northern & Central
-
Western
-
Southern
Competitive Landscape
Company Profiles: Detailed analysis of the major companies present in the Saudi Arabia Commercial Vehicle Market.
Available Customizations:
Saudi Arabia Commercial Vehicle Market report with the given market data, TechSci Research offers customizations according to a company's specific needs. The following customization options are available for the report:
Company Information
- Detailed analysis and profiling of additional market players (up to five).
Saudi Arabia Commercial Vehicle Market is an upcoming report to be released soon. If you wish an early delivery of this report or want to confirm the date of release, please contact us at sales@techsciresearch.com