|
Key Insights
|
Details
|
|
Forecast Period
|
2027-2031
|
|
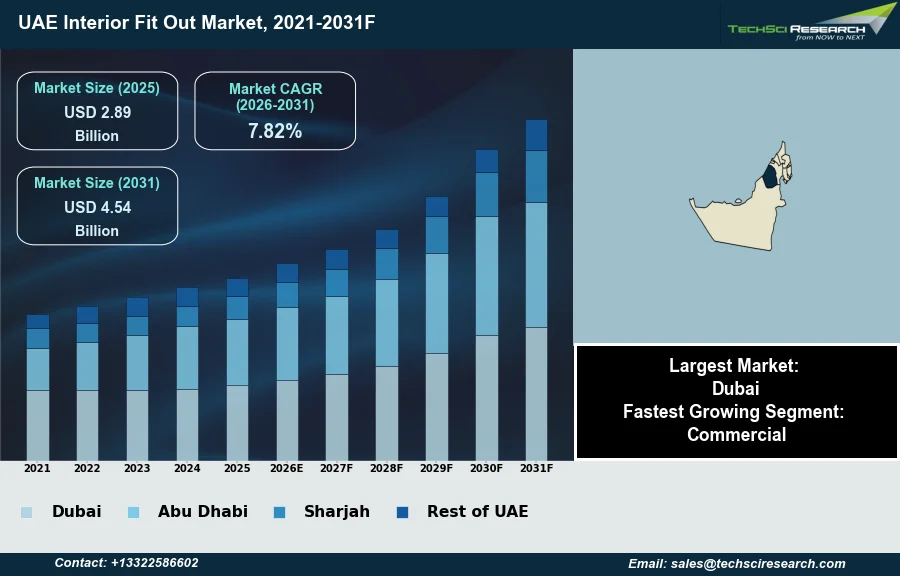
Market Size (2025)
|
USD 2.89 Billion
|
|
CAGR (2026-2031)
|
7.82%
|
|
Fastest Growing Segment
|
Commercial
|
|
Largest Market
|
Dubai
|
|
Market Size (2031)
|
USD 4.54 Billion
|
Market Overview
The UAE Interior Fit Out Market will grow from USD 2.89 Billion in 2025 to USD 4.54 Billion by 2031 at a 7.82% CAGR. The UAE Interior Fit-Out Market encompasses the comprehensive process of transforming interior spaces into functional, aesthetic, and fully equipped environments tailored to occupant requirements. This typically involves the installation of essential elements such as flooring, lighting, partitions, and MEP systems, extending to decorative finishes and furnishings. The market's growth is primarily propelled by robust demographic expansion, significant government investment in diverse infrastructure projects, and continued urbanization across the Emirates. For instance, according to the Dubai Land Department, in 2025, property sales in Dubai surged to AED 682.49 billion, marking a substantial 30.64% increase from the previous year and highlighting sustained real estate activity that fuels fit-out demand.
These fundamental drivers are further bolstered by the UAE's strategic focus on tourism and hospitality, which continuously necessitates new and refurbished establishments. However, a significant challenge impeding market expansion is the persistent issue of rising construction material costs, influenced by global supply chain disruptions and inflationary pressures.
Key Market Drivers
Urbanization and Infrastructure Growth Driving Interior Fit-Out Demand
Rapid urbanization and significant infrastructure development across the UAE are fundamental accelerators for the interior fit-out market, generating consistent demand for new and modernized spaces. This trend is exemplified by extensive commercial and residential expansions, which necessitate comprehensive interior solutions. These projects include not only new builds but also the ongoing enhancement of existing urban landscapes to meet evolving needs. For instance, according to Arabian Business, in April 2026, the expansion of the Dubai International Financial Centre (DIFC) alone is valued at AED 100 billion, underscoring the substantial investments directed towards creating advanced business and living environments. Such large-scale developments inherently integrate interior fit-out services from design conception through to final execution, covering everything from advanced MEP systems to bespoke aesthetic finishes.
Hospitality Growth and Construction Activity Driving Fit-Out Opportunities
Furthermore, the booming tourism and hospitality sector is a critical catalyst, continuously driving the need for new hotels, resorts, and entertainment venues, alongside regular refurbishment cycles for existing establishments. This demand often focuses on creating unique guest experiences and high-end interiors. According to TTE Gulf Management Consultancy, in October 2025, Dubai notably leads the Middle East hospitality project pipeline with 19,200 new hotel rooms currently in development, directly stimulating the fit-out sector with projects requiring specialized design and installation services. The overall market activity, fueled by these drivers, positions the broader construction industry, a direct precursor to fit-out demand, for robust performance. According to Khaleej Times, in May 2026, the UAE construction sector is projected to reach AED 189.59 billion. This comprehensive expansion across various segments ensures a sustained pipeline of opportunities for interior fit-out companies.
Download Free Sample Report
Key Market Challenges
Material cost increases impede UAE interior fit-out market growth.
Rising construction material costs represent a significant challenge impeding the growth of the UAE Interior Fit-Out Market. This escalation directly impacts project viability by increasing the overall expenditure for fit-out contractors and their clients. Higher material procurement costs inevitably lead to diminished profit margins for companies operating in the sector. This can result in increased project bids, making new developments less attractive, or necessitate a reduction in the scope of planned interior transformations to remain within allocated budgets. According to the RICS Global Construction Monitor, in Q1 2026, current profit margins for construction firms in the Middle East and Africa region, which includes the UAE, deteriorated further to a net balance of -29% from -20% in the previous quarter. This substantial decline in profitability directly hampers market expansion by reducing the capital available for reinvestment and deterring firms from undertaking new projects. The persistent upward trend in material expenses, driven by global supply chain disruptions and inflationary pressures, creates an unpredictable cost environment, making long-term strategic planning and project forecasting considerably more complex and riskier for all market participants.
Key Market Trends
Sustainable Design and Mandatory Green Compliance
Sustainable and Green Interior Design Practices are significantly reshaping the UAE Interior Fit Out Market as clients increasingly prioritize environmentally responsible and healthy spaces. This involves selecting eco-friendly materials, energy-efficient lighting, and indoor air quality solutions, driven by environmental awareness and long-term operational benefits. According to Dar Al Naseeb Engineering Consultants, January 2026, in "Al Sa'fat 2.0 Dubai 2026: Complete Green Building Compliance Guide", Al Sa'fat 2.0 Silver compliance became mandatory for all new building permits in Dubai from 2026, requiring a 20% energy reduction above the ASHRAE 90.1 baseline. This necessitates fit-out companies adapting their material sourcing and design to meet certifications and client mandates.
Smart Technology Adoption and Investment in UAE Interiors
The integration of Smart Technology in Interior Spaces is another pivotal trend, transforming occupant interaction with environments in the UAE. This includes automated lighting, climate control, and security systems, creating intuitive and efficient interconnected spaces. According to GlobeNewswire, April 2026, in "UAE Building Renovation & Retrofit Market Forecast Report 2025-2030", an estimated AED 3 billion investment in smart technologies is anticipated for UAE building renovation and retrofit projects, enhancing energy management and operational cost reduction. This impacts commercial and hospitality sectors, driving demand for specialized technological expertise in the fit-out industry.
Segmental Insights
Drivers of Growth in the UAE Interior Fit-Out Market
The Commercial segment stands as the fastest-growing sector within the UAE Interior Fit Out Market. This accelerated growth is largely attributed to the nation's proactive economic diversification strategies, exemplified by initiatives such as the Dubai D33 Agenda, which stimulate considerable investment in commercial infrastructure and urban development. The continuous establishment of new business districts and free zones, alongside the robust expansion of the tourism and hospitality industries, consistently generates demand for modern, high-quality interior spaces. Furthermore, businesses are increasingly prioritizing advanced and flexible office environments to enhance productivity and align with contemporary design trends, thereby sustaining significant fit-out activity across diverse commercial applications.
Regional Insights
Dubai's interior fit-out leadership: driven by urban growth, luxury demand, and regulatory rigor.
Dubai stands as the foremost region within the UAE Interior Fit Out Market, primarily due to its ongoing robust urban development and significant infrastructure projects. The city's thriving tourism and hospitality sectors consistently generate substantial demand for high-quality, distinctive interior designs across hotels, restaurants, and entertainment venues. Furthermore, Dubai's luxury real estate market attracts an affluent clientele seeking premium and customized fit-out solutions. This dominance is also bolstered by proactive government initiatives, such as the Dubai 2040 Urban Master Plan, and stringent regulatory oversight from bodies like Dubai Municipality, which enforces building codes and sustainability standards, including the "Al Sa'fat" program, ensuring superior quality and adherence to modern requirements.
Recent Developments
-
In September 2025, USBC Interiors, a prominent interior fit-out and design firm based in Dubai, announced its strategic expansion into Abu Dhabi. This initiative represented a significant milestone for the company, extending its innovative and sustainable design solutions to a broader market within the UAE. The expansion aimed to address the increasing demand for bespoke, functional, and aesthetically pleasing interior spaces across Abu Dhabi's residential, commercial, and hospitality sectors. This move was also anticipated to foster strategic collaborations with local businesses and generate new employment opportunities within the region's design industry.
-
In July 2025, ALEC, a leading contractor in the UAE, achieved significant recognition at the Digital Construction Awards 2025, securing three prestigious accolades: Digital Contractor of the Year, Digital Team of the Year – Contractor, and Digital Construction Project of the Year – Building. These awards underscored ALEC's commitment to digital innovation and its effective implementation of cutting-edge technologies across its projects. The company's digital transformation initiatives included streamlining workflows through automation and enhancing collaboration via advanced Building Information Modeling (BIM) practices, highlighting its leadership in technological advancements within the UAE's interior fit-out market.
-
In May 2025, ME FITOUT, a UAE interior fit-out company, launched a new high-tech, sustainability-driven manufacturing facility in Dubai Investment Park. This 100,000-square-foot facility was designed to elevate quality, efficiency, and sustainability standards for complex, large-scale interior contracting projects. It integrated advanced European machinery, intelligent recycling systems, and material optimization software to support high-output production while minimizing waste. The new facility was strategically positioned to meet the increasing demand for smart, sustainable, and luxurious environments across the UAE's hospitality, corporate, retail, and high-end residential markets.
-
In March 2025, Summertown Interiors continued to demonstrate its leadership in sustainable interior fit-out solutions across the UAE by delivering multiple projects targeting or achieving LEED Gold certification. The company had previously distinguished itself as the first fit-out contractor in the UAE to secure LEED Gold certification for its own office interior and consistently maintained LEED Gold for Operations and Maintenance. This ongoing commitment involved the integration of eco-friendly materials, energy-efficient designs, and responsible construction practices in commercial, healthcare, and education projects, setting benchmarks for high-quality, environmentally conscious interior design in the region.
Key Market Players
- Al Futtaim Interiors
- Khidmah
- EFS Facilities Services
- Serco Middle East
- G4S UAE
- ISS Middle East
- Cleantec
- Enova FM
- Transguard Group
- Atelier Interiors
|
By Application
|
By Ownership
|
By Region
|
- Residential
- Hospitality
- Commercial
- Retail
- Education
- Healthcare and Others
|
|
- Dubai
- Abu Dhabi
- Sharjah
- Rest of UAE
|
Report Scope:
In this report, the UAE Interior Fit Out Market has been segmented into the following categories, in addition to the industry trends which have also been detailed below:
-
UAE Interior Fit Out Market, By Application:
-
Residential
-
Hospitality
-
Commercial
-
Retail
-
Education
-
Healthcare and Others
-
UAE Interior Fit Out Market, By Ownership:
-
UAE Interior Fit Out Market, By Region:
-
Dubai
-
Abu Dhabi
-
Sharjah
-
Rest of UAE
Competitive Landscape
Company Profiles: Detailed analysis of the major companies present in the UAE Interior Fit Out Market.
Available Customizations:
UAE Interior Fit Out Market report with the given market data, TechSci Research offers customizations according to a company's specific needs. The following customization options are available for the report:
Company Information
- Detailed analysis and profiling of additional market players (up to five).
UAE Interior Fit Out Market is an upcoming report to be released soon. If you wish an early delivery of this report or want to confirm the date of release, please contact us at sales@techsciresearch.com