|
Key Insights
|
Details
|
|
Forecast Period
|
2027-2031
|
|
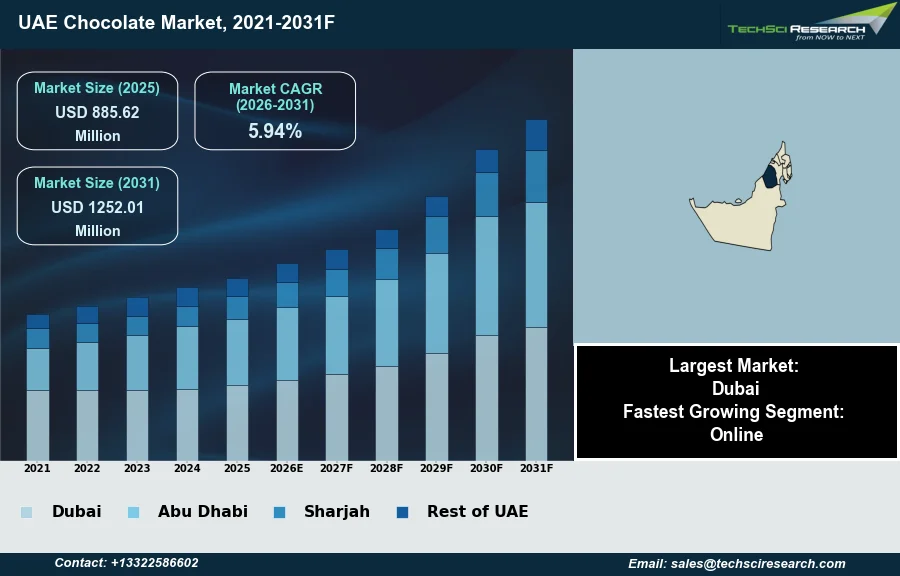
Market Size (2025)
|
USD 885.62 Million
|
|
CAGR (2026-2031)
|
5.94%
|
|
Fastest Growing Segment
|
Online
|
|
Largest Market
|
Dubai
|
|
Market Size (2031)
|
USD 1252.01 Million
|
Market Overview
The Chocolate Market in UAE will grow from USD 885.62 Million in 2025 to USD 1252.01 Million by 2031 at a 5.94% CAGR. The UAE chocolate market encompasses products derived predominantly from cocoa beans, including various forms such as bars, pralines, and other confectionery items, catering to diverse consumer preferences. Key drivers supporting its growth include rising disposable incomes, a robust tourism sector, and deeply rooted cultural traditions of gift-giving during festive periods. According to the ISM Middle East CocoaRadar Trend Report, the broader Asia-Pacific, Middle East, and Africa sweets and snacks market is projected to reach US$389.8 billion by the end of 2025, highlighting significant regional confectionery demand that includes the UAE.
However, a significant challenge impeding market expansion is the inherent volatility of global cocoa prices, which directly impacts raw material costs and pressures profit margins for manufacturers and importers in the UAE.
Key Market Drivers
Affluent UAE Demographics Drive Premium Chocolate Demand
The high disposable income and affluent consumer base within the UAE represent a primary driver for the chocolate market, enabling consumers to frequently indulge in premium and luxury chocolate varieties. This economic strength supports higher per-capita spending on non-essential, high-quality goods, including confectionery. The presence of a significant wealthy demographic further stimulates demand for specialized and imported chocolates. According to Knight Frank, April 29, 2025, in the 'Influx of millionaires sees UAE become world’s 14th largest wealth market', the total number of dollar millionaires in the UAE stood at 130,500 as of December 2024, positioning it as the 14th-largest wealth market globally. This substantial wealth underpins the market's capacity for growth, especially in the premium segment, as consumers seek unique flavor profiles and high-end brands.
Tourism and Duty-Free Spending Boost Chocolate Sales
The robust tourism and hospitality sector also significantly contributes to the UAE chocolate market by attracting a large volume of international visitors who frequently purchase chocolates as gifts or for personal consumption. Tourist spending within retail and duty-free channels, particularly for regional specialty chocolates, creates consistent demand. According to Dubai's Department of Economy and Tourism, February 7, 2024, in the 'Dubai Achieves its Best Ever Annual Tourism Performance with International Tourists Growing by 19.4% to 17.15 million in 2023', Dubai welcomed 17.15 million international overnight visitors in 2023, reflecting a substantial influx of potential consumers. This dynamic visitor base, combined with the domestic affluent population, drives a considerable portion of chocolate sales. In 2024, confectionery sales at Dubai Duty Free reached Dhs845.486 million (US$231.640 million), with 'Dubai chocolate' sales specifically contributing 719 tons to this total, highlighting the sector’s overall strength.
Download Free Sample Report
Key Market Challenges
Cocoa Price Volatility and UAE Chocolate Market Growth
The inherent volatility of global cocoa prices presents a significant impediment to the expansion of the UAE chocolate market. This fluctuation directly impacts the raw material costs for both manufacturers and importers operating within the Emirates. Unpredictable cocoa pricing complicates financial planning and procurement strategies, making it challenging for businesses to maintain stable production costs. According to the International Cocoa Organization, in October 2025, cocoa prices in London dropped from approximately US$6,320 to US$5,808 per ton, while in New York, they fell from US$6,686 to US$6,133 per ton. Such rapid shifts in commodity value compress profit margins, especially for mass-market chocolate products where pricing flexibility is limited. The increased capital required to navigate these price risks and the potential for reduced processing volumes directly constrain investment in product development and market reach, thereby hampering overall market growth.
Key Market Trends
Health-conscious demand drives product innovation
The expanding health-conscious chocolate options represent a significant trend shaping the UAE chocolate market. Consumers are increasingly seeking products aligned with wellness goals, leading to a rising demand for dark chocolate with higher cocoa content, as well as sugar-free, organic, and plant-based alternatives. This shift is prompting manufacturers and importers to innovate their product portfolios, introducing items that cater to dietary restrictions and healthier lifestyles. For instance, the focus on sugar reduction is particularly relevant given the UAE's adult diabetes prevalence was reported at 20.7% by the International Diabetes Federation in 2024, compelling brands to offer more mindful indulgence options.
E-commerce expansion reshapes UAE chocolate distribution
Concurrently, the increasing adoption of e-commerce distribution channels is transforming how chocolates are purchased in the UAE. The convenience and accessibility offered by online platforms are driving a notable shift in consumer buying behavior, allowing for a broader selection of products and direct-to-consumer models. This digital transition provides chocolate brands with expanded reach beyond traditional retail outlets and enables targeted marketing strategies. The robust growth in this segment is evident as the UAE's food e-commerce retail sales reached $1.07 billion in 2023, indicating a substantial and expanding online market for confectionery products.
Segmental Insights
Online Channel: Fastest-Growing UAE Chocolate Distribution Channel
The Online segment emerges as the fastest-growing distribution channel within the UAE Chocolate Market, a trajectory predominantly fueled by the nation's advanced digital infrastructure and high internet penetration. This robust digitalization has cultivated a tech-savvy consumer base that values the extensive convenience provided by e-commerce platforms. Consumers are increasingly utilizing mobile applications to effortlessly explore a wide array of chocolate brands, compare product offerings, and avail themselves of efficient doorstep delivery services, which perfectly aligns with the demanding urban lifestyles characteristic of the UAE. Moreover, the strategic expansion of both local and international online retailers, combined with the strong cultural emphasis on gifting, wherein digital channels facilitate personalized and premium chocolate purchases, significantly underpins this segment's accelerated growth.
Regional Insights
Dubai: Leading UAE Chocolate Market Driven by Trade Hub, Tourism, and Affluent Demand
Key regional insights indicate Dubai as the leading region within the UAE Chocolate Market, a position driven by its distinctive commercial environment and consumer behaviors. Dubai's strategic role as a global trading hub ensures efficient import and distribution channels for a wide array of chocolate products. The city's status as a premier tourist destination, coupled with a substantial affluent population and a prominent gifting culture, generates significant demand for luxury, artisanal, and international chocolate brands. Its developed retail infrastructure, encompassing high-end shopping and duty-free outlets, further solidifies Dubai’s dominance in the confectionery sector.
Recent Developments
-
In October 2025, Al Nassma, a company renowned for its camel milk chocolate, unveiled the Samha Kunafa Bonbon Collection. This new chocolate line was designed to capture the essence of its signature kunafa ingredient in a modern, giftable format. The collection offered three distinct flavors: Dark Pistachio Kunafa, Milk Pistachio Kunafa, and White Macadamia Kunafa. Each variant combined camel milk chocolate with crunchy kunafa and premium nuts, aiming to deliver a unique taste experience directly linked to Dubai's vibrant culinary identity.
-
In December 2024, Lindt, a prominent chocolate manufacturer, launched its "Dubai Style Chocolate" product in travel retail, initially at Zurich airport in collaboration with a global travel retail giant. This new chocolate, featuring milk chocolate filled with pistachio crème and pastry, was inspired by a popular Middle Eastern sweet. Following its immediate success, the product was rapidly introduced to numerous other airports globally in early 2025, becoming a top-selling item and significantly impacting the premium segment of the UAE-inspired chocolate market.
-
In November 2024, the company Careem collaborated with the founder of Forever Rose, a luxury brand, to introduce a new line of high-end Belgian chocolate bars. This partnership aimed to offer exclusive confectionery products, with flavors specifically inspired by local tastes and preferences in the UAE. The luxury chocolate bars were made available for distribution exclusively through Careem Groceries in Dubai and Abu Dhabi, marking a strategic move to enhance premium product offerings within the UAE's competitive chocolate market.
-
In March 2024, FIX Dessert Chocolatier, a Dubai-based company, experienced significant international attention for its "Can't Get Knafeh Of It" chocolate bar. This new product featured milk chocolate with a distinctive filling of pistachio cream, tahini, and crispy knafeh pastry. The bar quickly achieved viral status across social media platforms, leading to immense demand in the UAE chocolate market and inspiring similar creations globally. The widespread popularity underscored a growing consumer interest in unique, locally inspired flavor profiles within the confectionery sector.
Key Market Players
- Al Nassma Chocolate LLC
- Patchi UAE
- Forrey & Galland Chocolatier
- Mirzam Chocolate Makers
- Al Kazemi Chocolate
- Bateel International LLC
- Godiva Middle East
- Mars GCC
- Nestle Middle East
- Ferrero Middle East
|
By Type
|
By Sales Channel
|
By Region
|
- Softlines/Selflines
- Boxed Assortments
- Countlines
- Molded Chocolates
- and Others
|
- Supermarkets/Hypermarkets
- Convenience Stores
- Specialty Stores
- Online
- and Others
|
- Dubai
- Abu Dhabi
- Sharjah
- Rest of UAE
|
Report Scope:
In this report, the UAE Chocolate Market has been segmented into the following categories, in addition to the industry trends which have also been detailed below:
-
UAE Chocolate Market, By Type:
-
Softlines/Selflines
-
Boxed Assortments
-
Countlines
-
Molded Chocolates
-
and Others
-
UAE Chocolate Market, By Sales Channel:
-
Supermarkets/Hypermarkets
-
Convenience Stores
-
Specialty Stores
-
Online
-
and Others
-
UAE Chocolate Market, By Region:
-
Dubai
-
Abu Dhabi
-
Sharjah
-
Rest of UAE
Competitive Landscape
Company Profiles: Detailed analysis of the major companies present in the UAE Chocolate Market.
Available Customizations:
UAE Chocolate Market report with the given market data, TechSci Research offers customizations according to a company's specific needs. The following customization options are available for the report:
Company Information
- Detailed analysis and profiling of additional market players (up to five).
UAE Chocolate Market is an upcoming report to be released soon. If you wish an early delivery of this report or want to confirm the date of release, please contact us at sales@techsciresearch.com