Forecast Period | 2027-2031 |
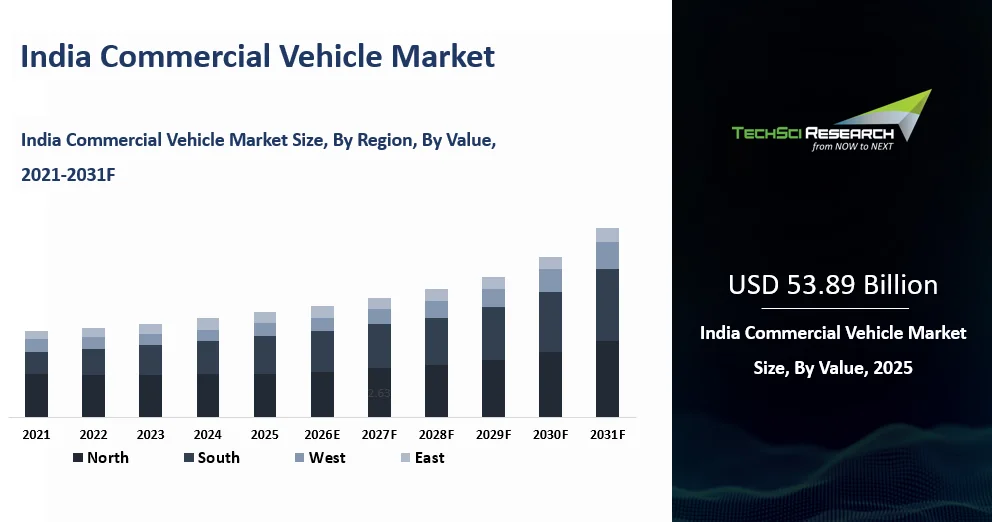
Market Size (2025) | USD 53.89 Billion |
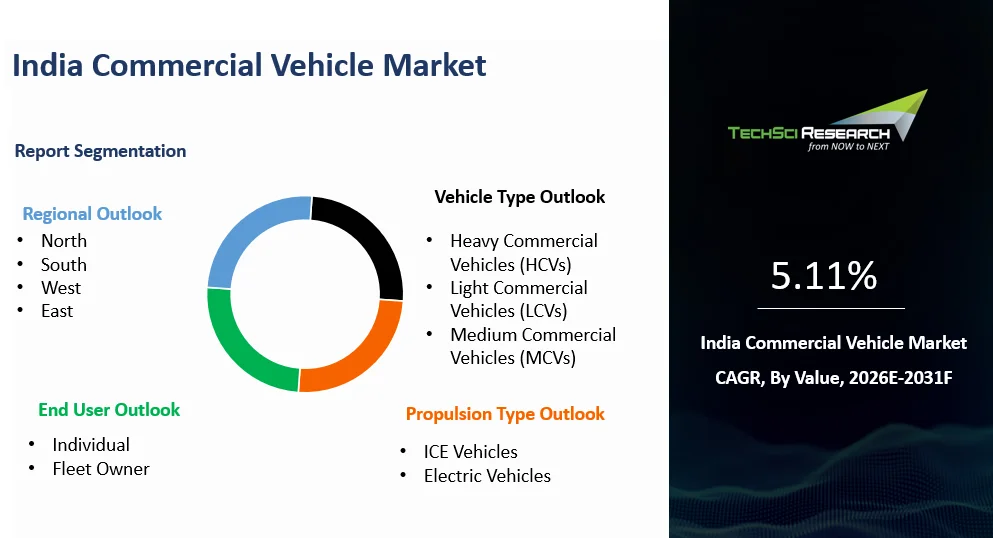
CAGR (2026-2031) | 5.11% |
Fastest Growing Segment | Electric Vehicles |
Largest Market | North |
Market Size (2031) | USD 72.67 Billion |
Market Overview:
India Commercial Vehicle Market was valued at USD 53.89 Billion in 2025 and is expected to reach USD 72.67 Billion by 2031 with a CAGR of 5.11% during the forecast period. India’s commercial vehicle market is witnessing significant evolution, driven by shifting logistics dynamics, rapid urbanization, and rising demand for efficient freight mobility. Light Commercial Vehicles (LCVs) are gaining prominence due to their adaptability in congested city environments and last-mile delivery operations. Urban and semi-urban areas are seeing increased demand for compact and agile transport solutions to address infrastructure limitations and traffic density. Simultaneously, Medium and Heavy Commercial Vehicles (MHCVs) continue to serve long-haul freight and industrial sectors, with fleet operators upgrading to more efficient, emission-compliant models.
Market Drivers
E-commerce Expansion
The explosive growth of e-commerce in India is significantly influencing the commercial vehicle market, particularly in the LCV and small truck segments. As online retail continues to penetrate Tier II, III, and rural markets, logistics companies are expanding their vehicle fleets to meet rising delivery demands. LCVs are increasingly preferred for last-mile connectivity due to their compact size, sufficient load capacity, and ease of maneuverability in dense urban areas. Simultaneously, M&HCVs are being utilized for warehouse-to-warehouse and inter-city bulk movements. The growing focus on rapid and reliable delivery services is prompting investments from courier companies, aggregators, and SMEs, driving the overall demand for commercial vehicles. For instance, In FY2025, India’s commercial vehicle sales are projected to near one million units, returning to pre-pandemic levels, driven by infrastructure growth, strong replacement demand, and government policies like the PM-eBus Sewa scheme. Light commercial vehicles, comprising 62% of volumes, lead growth fueled by e-commerce and warehousing, while medium and heavy commercial vehicles grow steadily on infrastructure investments. The sector expects 3-5% volume growth with stable margins, supported by easing input costs and healthy cash flows, despite regulatory changes like mandatory air-conditioned cabins and rising capex on safety, emissions, and EV platforms.
Urbanization and Infrastructure Growth
Accelerating urbanization and the government’s infrastructure push are key enablers for commercial vehicle demand. The development of highways, dedicated freight corridors, and improved rural road networks under initiatives like Bharatmala and PM Gati Shakti is enhancing freight mobility across regions. This infrastructure boom is boosting demand for both LCVs and MHCVs LCVs for short-haul urban and peri-urban distribution, and MHCVs for long-distance and heavy-duty logistics. The expanding real estate and construction sectors are also generating demand for tipper trucks, haulage vehicles, and specialized CVs that support materials movement within urban clusters and growing suburbs. For instance, India’s infrastructure saw strong growth with USD 120 billion allocated in 2023-24 and USD 185 billion worth of projects under PM Gati Shakti. National Highways expanded to 1,46,145 km, ports raised capacity to 1,630 MTPA, and aviation grew to 157 airports. Railways electrified 25,871 km of tracks and hit 30 million daily passengers. Urban projects under Smart Cities and metro rail advanced, while the Jal Jeevan Mission connected 154.4 million rural homes with tap water.
MSME Sector Expansion
India’s MSME sector, a critical pillar of the economy, is increasingly relying on commercial vehicles for day-to-day business operations. From transporting raw materials and finished goods to supporting on-ground service delivery, commercial vehicles especially LCVs are essential enablers of business efficiency. Government initiatives focused on MSME development, ease of credit, and entrepreneurship promotion are enhancing vehicle affordability and adoption. Flexible financing options and support from NBFCs are encouraging small businesses and traders in both rural and semi-urban regions to invest in CVs, driving steady market expansion. For instance, as of December 2024, 57 million MSMEs employing 241.4 million people are registered in India. The MSME Ministry received a 4.6% higher budget of USD 2.78 billion for FY26. Under government support, USD 47.6 billion worth of Mudra loans were sanctioned in FY25, while the RAMP scheme benefitted 400,000 MSMEs, with 38% women-owned units. The FY26 budget revised MSME investment limits micro-enterprises up to USD 0.3 million, small enterprises USD 2.9 million, and medium enterprises USD 14.4 million with higher turnover thresholds to boost sector growth.
Download Free Sample Report
Key Market Challenges
High Financing Barriers
Despite rising demand, access to affordable vehicle financing remains a key hurdle especially for buyers in rural and semi-urban regions. Many small business owners and first-time vehicle users struggle with limited credit history, high interest rates, or restrictive loan conditions. Though NBFCs are active in this space, financing gaps persist, slowing down adoption among micro-entrepreneurs and informal logistics providers who depend heavily on LCVs for their livelihood.
Inadequate Aftermarket Ecosystem
The reliability and reach of aftersales service networks remain inconsistent, particularly outside metro areas. Spare parts shortages, a lack of trained mechanics, and limited service centers increase maintenance costs and reduce vehicle uptime. The issue is more pronounced for electric and advanced commercial vehicles, where technical expertise and diagnostic infrastructure are still evolving. This gap in support infrastructure discourages users from adopting newer vehicle technologies and affects lifecycle management.
Key Market Trends
Electrification of Light Commercial Vehicles
The shift toward electric mobility is gaining traction, especially in the LCV segment. Rising fuel prices, government incentives under schemes like FAME II, and stricter emission norms are encouraging the adoption of electric commercial vehicles for intra-city deliveries. Logistics companies, startups, and last-mile operators are increasingly deploying electric LCVs to reduce operational costs and meet sustainability goals. For instance, In India, electric 4W commercial vehicle adoption is gaining momentum, with EV penetration in the light commercial vehicle (LCV) segment reaching 1.4% by March 2025. Experts project this figure could rise to 15% by 2030, driven by fleet electrification, cost savings, and increasing model availability expected to grow from 5-6 models in 2024 to 15 models in 2025. Maharashtra led e-goods carrier sales with 357 units sold (Jan-Mar 2025), followed by Tamil Nadu (285 units) and Karnataka (156 units), reflecting strong regional demand. Rising e-commerce, sustainability goals, and favorable cost of ownership are propelling the e-LCV market’s rapid growth.
Growth of Telematics and Fleet Digitization
Fleet operators are adopting telematics and digital fleet management tools to improve efficiency, track vehicle performance, and optimize routing. These technologies enable real-time monitoring, predictive maintenance, and fuel tracking, leading to cost savings and higher productivity. Digitization is becoming a key differentiator, particularly for organized logistics providers and aggregators.
Segmental Insights
Vehicle Type Insights
In 2025, Light Commercial Vehicles (LCVs) continued to dominated the India commercial vehicle market by volume, driven by their critical role in last-mile delivery, urban freight, and intra-city logistics. The surge in e-commerce, expanding retail distribution, and growth in organized delivery networks sustained high demand for LCVs, especially in densely populated urban and semi-urban areas. Small fleet operators and MSMEs increasingly favored LCVs due to affordable financing options, lower operating costs, and flexibility in operations. The segment also witnessed rising adoption of electric and CNG variants as businesses aimed to reduce fuel expenses and align with evolving regulatory norms. The focus on efficient, compact transport solutions reinforced the position of LCVs as the leading segment in 2025, making them a key driver of growth in the India commercial vehicle market.
Download Free Sample Report
Region Insights
North India
In North India, states like Delhi, Uttar Pradesh, Haryana, and Punjab are key contributors to the commercial vehicle market, driven by strong demand from agriculture, construction, and inter-state logistics. The region’s dense road networks and proximity to industrial hubs and NCR (National Capital Region) support high movement of both goods and people. Government infrastructure projects such as expressways and freight corridors further boost heavy and medium commercial vehicle deployment.
South India
South India, comprising states like Tamil Nadu, Karnataka, Telangana, and Andhra Pradesh, is a major hub for automobile manufacturing, IT logistics, and intra-city transport. The growing e-commerce footprint, presence of port-based trade, and strong MSME activity drive significant demand for LCVs and intra-regional freight vehicles. Cities like Chennai, Bengaluru, and Hyderabad are key hotspots for fleet expansion and electric commercial vehicle adoption, supported by state-level EV policies and improving charging infrastructure. Both regions play pivotal roles in the sector’s overall growth trajectory.
Recent Developments
- In March 2024, Daimler India Commercial Vehicles announced plans to launch 14 new BharatBenz trucks and buses, focusing on fuel efficiency, safety, and local R&D to meet rising infrastructure and logistics demand.
- In February 2024, Eicher Trucks and Buses entered the SCV segment with its electric-first approach, unveiling models between 2T–3.5T GVW and launching India's first 5.5T electric truck, LNG/CNG options, and a hydrogen ICE prototype.
- At Bharat Mobility Global Expo 2025, Ashok Leyland introduced the ‘Saathi’ entry-level LCV for small transporters, boasting a 24% larger loading area, low-maintenance tech, and a 5-year warranty, alongside previewing its GARUD 15 luxury bus.
- In December 2024, BharatBenz launched new heavy-duty rigid trucks with improved engines, payload, and durability, targeting construction, mining, and industrial logistics to enhance market presence.
- In November 2023, Eicher launched the Non-Stop Series of heavy-duty trucks—Pro 6019, 6035, and 6040—offering higher uptime, fuel efficiency, and safety, catering to mining, e-commerce, and logistics sectors.
Key Market Players
- Ashok Leyland Limited
- Eicher Motors
- Force Motors Limited
- Mahindra & Mahindra Ltd.
- Maruti Suzuki India Limited
- Piaggio Vehicles Private Limited
- SML Isuzu Limited
- Tata Motors Limited
- Toyota Motor Corporation
- VE Commercial Vehicles Limited
By Vehicle Type | By Propulsion Type | By End User | By Region |
- Heavy Commercial Vehicles (HCVs)
- Light Commercial Vehicles (LCVs)
- Medium Commercial Vehicles (MCVs)
| - ICE Vehicles
- Electric Vehicles
| | |
Report Scope:
In this report, the India Commercial Vehicle Market has been segmented into the following categories, in addition to the industry trends which have also been detailed below:
- India Commercial Vehicle Market, By Vehicle Type:
o Heavy Commercial Vehicles (HCVs)
o Light Commercial Vehicles (LCVs)
o Medium Commercial Vehicles (MCVs)
- India Commercial Vehicle Market, By Propulsion Type:
o ICE Vehicles
o Electric Vehicles
- India Commercial Vehicle Market, By End User:
o Individual
o Fleet Owner
- India Commercial Vehicle Market, By Region:
o Central
o East
o North
o South
Competitive Landscape
Company Profiles: Detailed analysis of the major companies presents in the India Commercial Vehicle Market.
Available Customizations:
India Commercial Vehicle Market report with the given market data, TechSci Research offers customizations according to the company’s specific needs. The following customization options are available for the report:
Company Information
- Detailed analysis and profiling of additional market players (up to five).
India Commercial Vehicle Market is an upcoming report to be released soon. If you wish an early delivery of this report or want to confirm the date of release, please contact us at sales@techsciresearch.com